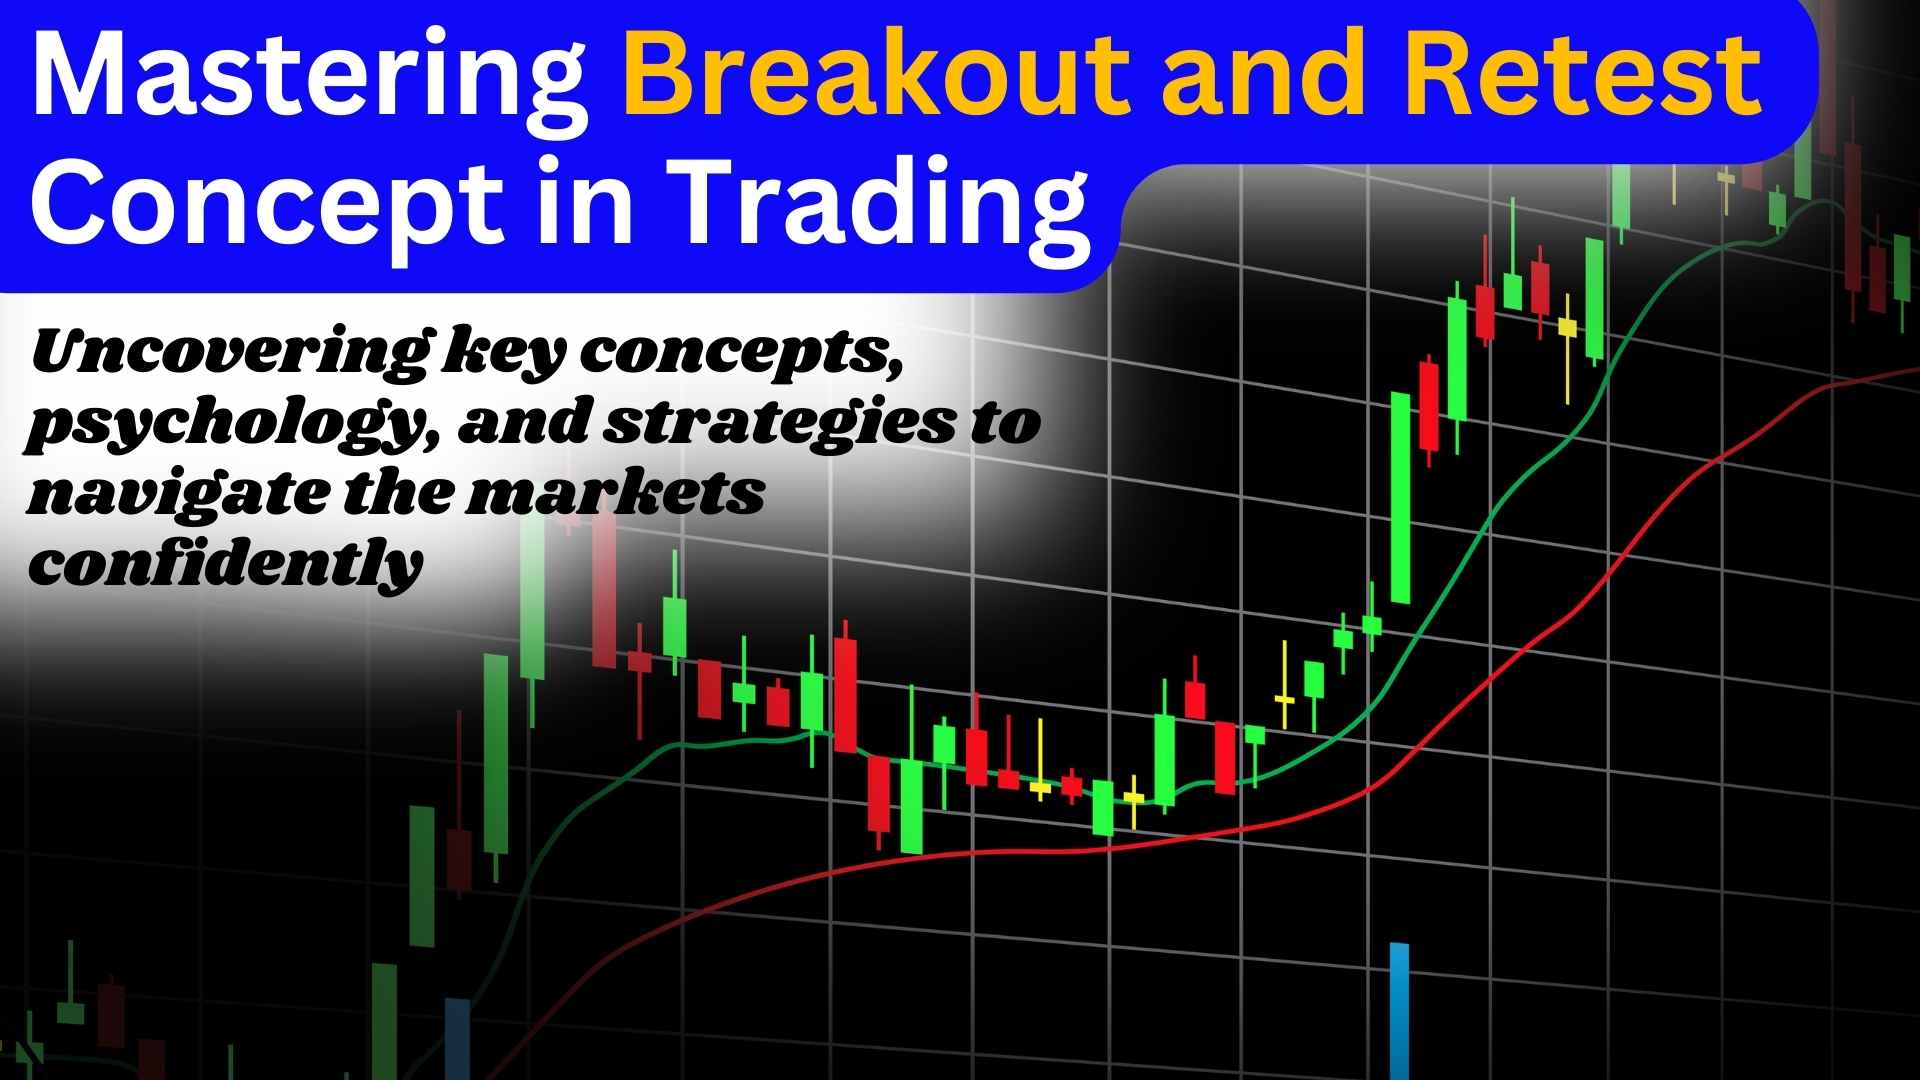
In the world of trading, understanding the concepts of “Breakouts” and “Retests” is crucial for success. These terms are fundamental in technical analysis, a method used by traders and investors to make informed decisions about buying and selling assets. But what exactly are breakouts and retests, and why are they important?
In this blog post, we’ll dive into the core principles of breakouts and retests, exploring how they signal shifts in market dynamics and provide opportunities for traders. We’ll also uncover the psychology behind these movements, delving into the role of fear, greed, and market sentiment in shaping price action. Additionally, we’ll discuss how to identify breakout opportunities and manage risks effectively in breakout and retest trading strategies.
Whether you’re new to trading or looking to enhance your skills, understanding these concepts and techniques can empower you to trade with confidence and navigate the financial markets more effectively. So, let’s get started on mastering the breakout and retest concept for successful trading endeavors.
You May Read – 6 Essential Investment Factors Every Beginner Should Know to evaluate investments
Understanding Breakout and Retest Strategies
The concepts of “Breakouts” and “Retests” are fundamental in technical analysis, a methodology used to evaluate investments and identify trading opportunities by analyzing statistical trends gathered from trading activity, such as price movement and volume. Understanding these concepts is essential for traders and investors who rely on technical analysis to make informed decisions.
What are Breakouts?
A breakout is fundamentally a signal that indicates a significant change in the supply and demand dynamics of an asset, leading to a move above a predefined resistance level or below a predefined support level. These levels are crucial because they represent points on a price chart where the forces of supply and demand meet and often battle, leading to a stall or reversal in price movement.
A breakout is essentially a signal that the price of an asset has moved beyond a defined level of support, resistance or Trendline with significant volume.
To understand breakouts, one must first understand these key points:
- Support: This is a price level at which a downward trending asset tends to stop falling due to a concentration of demand or buying interest. As the price of an asset drops, demand for the asset increases, forming a support level. Essentially, Support is a price level where buying interest tends to be strong enough to prevent the price from falling further.
- Resistance: Conversely, resistance is a price level at which an upward trending asset tends to stop rising due to a concentration of supply or selling interest. As the price of an asset rises, supply that outweighs demand at a certain price level forms a ceiling that the price cannot break through. So, Resistance is a price level where selling interest tends to be strong enough to prevent the price from rising further.
- Price Movement: When the price breaks above resistance or below support, it signifies a potential shift in the balance between buying and selling pressure. A breakout above resistance suggests increased buying interest, potentially indicating an upward trend, while a breakout below support suggests increased selling interest, potentially indicating a downward trend.
- Confirmation: Traders often look for confirmation signals to validate a breakout. This may include increased trading volume accompanying the breakout or the price closing convincingly above (in the case of a breakout above resistance) or below (in the case of a breakout below support) the identified level.
- Trend Strength: The strength of a breakout can vary. A strong breakout with high volume and a decisive move beyond the support or resistance level is often seen as more reliable, indicating a potentially robust trend.
When an asset’s price moves above a resistance level or below a support level, it signifies a breakout. This movement indicates a shift in the market’s balance between supply and demand. If the price breaks above a resistance level, it suggests that demand has overcome supply, indicating a potential upward trend. Conversely, if the price breaks below a support level, it implies that supply has overcome demand, indicating a potential downward trend. Breakouts are considered significant because they suggest that the sentiment in the market has shifted, offering potential for a strong trend in the direction of the breakout.
What are Retests?
Following a breakout, markets often experience a phenomenon known as a retest. A retest occurs when the price of an asset returns to the level of the breakout, but this time, from the opposite direction.
This Retest is crucial for several reasons:
- Confirmation of Breakout: A retest gives traders an opportunity to confirm the strength and validity of the breakout. It provides traders and investors with a chance to see whether the breakout was genuine or if it was a false signal. If the price successfully retests the breakout level and holds above (in the case of a breakout above resistance) or below (in the case of a breakout below support), it reinforces the strength of the breakout and suggests that the previous resistance level may now act as support, or vice versa.
- Role Reversal: In the context of a retest, the roles of support and resistance are reversed. A resistance level that has been broken through may now act as a new level of support, while a broken support level might turn into a new resistance level. This role reversal is a fundamental concept in technical analysis, indicating that previous barriers are now serving the opposite function. So, Retesting Resistance Turned Support and Retesting Support Turned Resistance.
- Entry and Exit Points: Traders may use retests as entry or exit points for their positions. For example, if a breakout occurs above resistance and is followed by a successful retest where the price holds above the former resistance level, traders might see this as a favorable entry point for long positions, expecting further upward movement.
- Risk Management: Retests also provide an opportunity for risk management. If a breakout fails to hold during the retest and the price moves back into the previous trading range, traders may consider exiting their positions to limit potential losses.
- Continuation Signal: If the price successfully retests the breakout level — holding above the new support in the case of an upward breakout or below the new resistance in the case of a downward breakout — it reinforces the breakout’s strength. This confirmation suggests that the trend initiated by the breakout is likely to continue.
- Opportunity: Retests offer traders a second chance to enter the market at a more favorable price, aligning their positions with the newly established trend. It’s an opportunity to enter trades with a higher probability of success, as the market has already shown a strong move in one direction and a successful retest indicates a continuation of that trend.
So, understanding breakouts and retests can help traders identify potential trends, confirm trading signals, and manage risk effectively in financial markets.
Breakouts and retests are fundamental concepts in technical analysis, providing traders with signals that can indicate the beginning of a new trend and offering opportunities to validate these signals before making trading decisions. The ability to accurately identify and interpret these movements is a valuable skill for anyone involved in trading or investing based on technical analysis.
You May Read – Mastering all Stock Market Terminology: Unlock Your Investment Potential
The Psychology Behind Breakout and Retest
Financial markets are not driven solely by economic indicators, algorithms, or market fundamentals; Human psychology plays an important role in shaping market movements, especially during breakouts and retests. The psychology behind breakouts and retests in financial markets is a fascinating interplay of fear, greed, market sentiment, and price action. These elements together create the dynamics observed around these technical patterns. Understanding the psychological foundation can provide valuable insight into why these patterns occur and how they affect market sentiment and price action.
Fear and Greed: The Driving Forces
The psychology behind breakouts and retests is deeply rooted in the collective emotions and behaviors of market participants. Two primary emotions, fear and greed, play critical roles in driving market sentiment and, consequently, price action. Understanding these psychological elements provides insight into why breakouts and retests occur and how they can be interpreted.
- Greed: Greed is the intense desire for wealth or gain. In the context of financial markets, greed drives investors and traders to pursue profit, often leading them to buy into an asset as its price starts breaking out above resistance. The collective action of buying in anticipation of further gains pushes the price even higher because it leading to an increased buying pressure as prices start breaking out above resistance levels. When an asset begins to breakout, the Fear of Missing Out (FOMO) kicks in, and more buyers enter the market, hoping to capitalize on the emerging trend.
- Fear: Fear is the emotion that motivates preservation and avoidance of loss. As the price of an asset breaks below support, fear of further losses prompts holders to sell their positions. This selling pressure exacerbates the price decline. Fear also comes into play during retests, where the fear of missing out on a potential trend reversal or continuation can lead to increased buying or selling pressure at the retest level. So, fear motivates selling and is particularly potent when prices break below support levels. Fear of loss compels traders to exit positions to prevent further losses, amplifying the selling pressure. Similarly, after a breakout, the fear of a failed breakout (price returning below a breakout level) can lead to quick sell-offs at the first sign of a retest.
Market Sentiment and Price Action
Market sentiment refers to the overall attitude of investors towards a particular security or market. It is a composite of multiple factors, including economic indicators, market rumors, and geopolitical events, and plays a crucial role in shaping price action around breakouts and retests.
During a Breakout:
When a breakout occurs, it often signifies a strong shift in market sentiment. For example, a breakout above resistance may indicate that the market sentiment has turned bullish, with a majority of traders expecting further price increases. This shift can lead to a self-reinforcing cycle where the expectation of higher prices attracts more buyers, driving the price up further. So, Positive sentiment (or greed) can accelerate a breakout, as traders anticipate continued movement in the direction of the break. Negative sentiment (or fear), on the other hand, can stall or reverse breakouts, making them less reliable.
During a Retest:
The retest phase is crucial for assessing the sustainability of the breakout and test of the market’s conviction in the new price level. If the price retests the former resistance (now potential support) and holds, it reassures the market participants of the new trend’s validity. This period is marked by a psychological battle between hope and fear—hope for the trend’s continuation and fear of a false breakout.
A successful retest that leads to a price bounce back in the direction of the breakout can solidify the sentiment and encourage more participants to join the trend, further fueling the price movement. If the sentiment remains positive after a breakout above resistance (now support), the successful retest reinforces the market’s confidence, leading to further bullish trends. Conversely, if the sentiment turns negative, a failed retest (where the price falls back below the new support level) can trigger a rapid reversal of the breakout.
Market sentiment is also reflected in price action, which is the movement of prices over time. Technical analysts study price action to identify patterns, such as breakouts and retests, that may indicate future price movements. The psychology behind these patterns is rooted in the collective actions of market participants responding to fear, greed, and changes in market sentiment.
So, the psychology behind breakouts and retests in financial markets is a manifestation of the fundamental human emotions of fear and greed, influenced by overall market sentiment. These psychological factors, in turn, drive price action, creating opportunities and risks for traders and investors.
Identification of Breakout Opportunities
Identifying breakout opportunities in financial markets involves a keen observation of various indicators, chart patterns, and volume analysis. These elements can provide traders with insights into potential shifts in market dynamics, offering opportunities for entry before a significant trend develops.
Key Indicators to Watch For
Several technical indicators are commonly used to identify potential breakouts:
- Moving Averages: Traders often watch for price action relative to moving averages, such as the 50-day or 200-day moving average. A breakout above a moving average can signal the start of an uptrend, while a breakout below can indicate the beginning of a downtrend.
- Relative Strength Index (RSI): The RSI measures the magnitude of recent price changes to evaluate overbought or oversold conditions. An RSI reading above 70 suggests overbought conditions (potential for a downward breakout), while a reading below 30 indicates oversold conditions (potential for an upward breakout).
- Bollinger Bands: These bands widen during periods of increased volatility and contract during low volatility. A price move that breaks above the upper Bollinger Band or below the lower band may indicate a breakout.
- Volume Oscillators: Indicators like the On-Balance Volume (OBV) can help identify divergences between price and volume trends, potentially signaling upcoming breakouts.
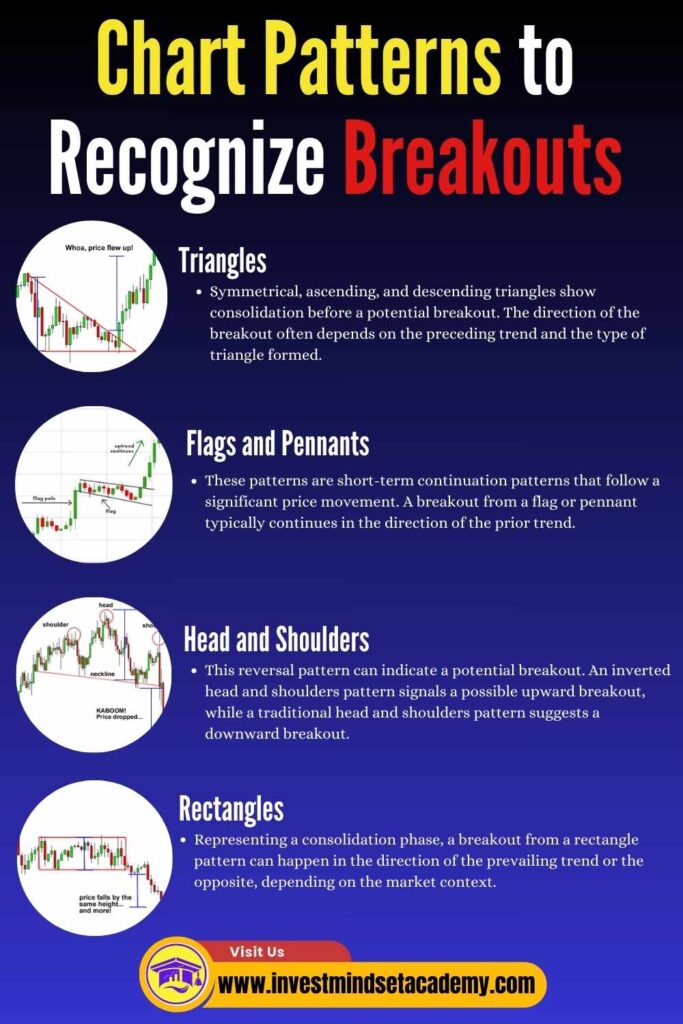
Chart Patterns to Recognize Breakouts
Certain chart patterns are precursors to potential breakouts:
- Triangles: Symmetrical, ascending, and descending triangles show consolidation before a potential breakout. The direction of the breakout often depends on the preceding trend and the type of triangle formed.
- Flags and Pennants: These patterns are short-term continuation patterns that follow a significant price movement. A breakout from a flag or pennant typically continues in the direction of the prior trend.
- Head and Shoulders: This reversal pattern can indicate a potential breakout. An inverted head and shoulders pattern signals a possible upward breakout, while a traditional head and shoulders pattern suggests a downward breakout.
- Rectangles: Representing a consolidation phase, a breakout from a rectangle pattern can happen in the direction of the prevailing trend or the opposite, depending on the market context.
Volume Analysis: Its Role in Confirming Breakouts
Volume plays a crucial role in confirming the strength and validity of breakouts:
- Increased Volume: A genuine breakout is often accompanied by a surge in trading volume, indicating strong participation in the move beyond support or resistance levels. This suggests conviction among traders and can reinforce the likelihood of trend continuation.
- Low Volume: If a breakout occurs on low volume, it might be a warning sign that the move lacks support from the market, and the breakout could be short-lived or false.
- Volume Trends: Analyzing volume trends leading up to the breakout can also provide insights. Gradually increasing volume suggests building pressure that could culminate in a significant breakout.
Identifying breakout opportunities requires a multifaceted approach, incorporating technical indicators, chart pattern recognition, and volume analysis. By carefully analyzing these elements, traders can enhance their ability to spot potential breakouts, assess their strength, and make informed trading decisions.
Breakout and retest trading strategy
The breakout and retest trading strategy usually includes these steps:
- Find important levels on the price chart where the price often stops falling or rising (support and resistance levels).
- Wait for the price to move past these levels strongly, either going up through resistance or dropping below support.
- Once the price breaks through, wait again to see if it comes back to test the new level (the old resistance becomes support, or the old support becomes resistance).
- Look for signs that the price is going to keep moving in the direction of the initial breakout, like positive movement after breaking above resistance or negative movement after breaking below support.
- Start a trade going the same way as the breakout, using safety measures like stop-loss orders to help minimize any losses.
- Keep an eye on the trade and think about changing your stop-loss orders or taking your profits based on how the price moves next and what the market is doing.
This strategy relies on the belief that when prices break past important levels, they often keep going in that direction for a while. The retest gives a chance to enter trades with less risk. But, like any strategy, there are risks involved, so it’s crucial to do thorough analysis and manage risks carefully.
Read More : 5 Breakout and retest trading strategy
Risk Management Techniques in Breakout and Retest Trading
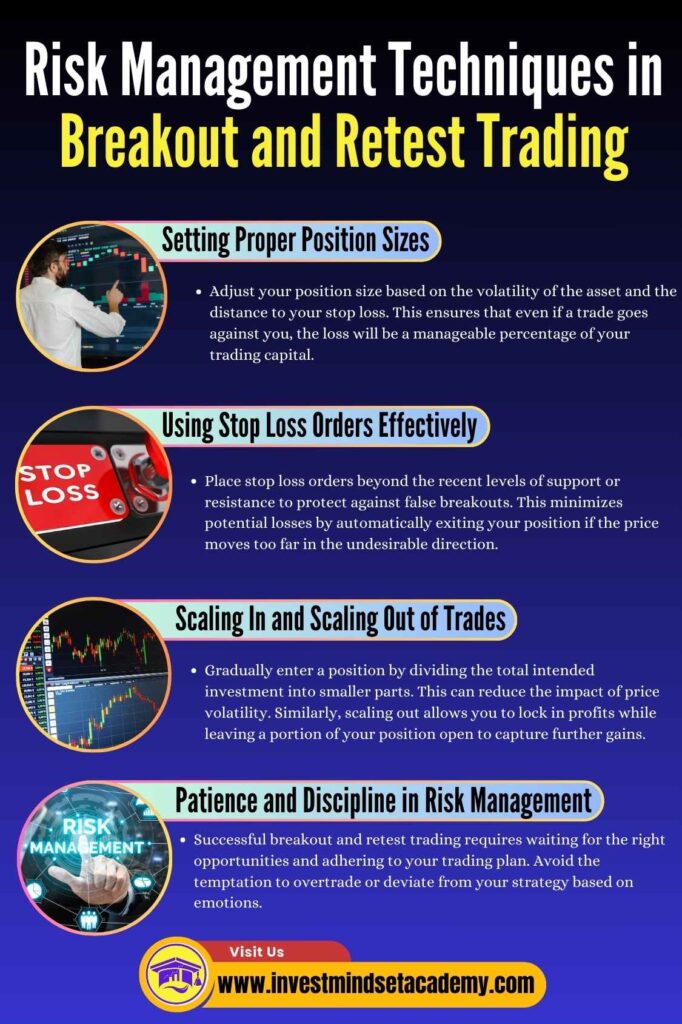
Effective risk management is essential in breakout and retest trading strategies to protect gains and minimize losses. Here are key techniques to consider:
- Setting Proper Position Sizes
- Adjust your position size based on the volatility of the asset and the distance to your stop loss. This ensures that even if a trade goes against you, the loss will be a manageable percentage of your trading capital.
- Using Stop Loss Orders Effectively
- Place stop loss orders beyond the recent levels of support or resistance to protect against false breakouts. This minimizes potential losses by automatically exiting your position if the price moves too far in the undesirable direction.
- Scaling In and Scaling Out of Trades
- Gradually enter a position by dividing the total intended investment into smaller parts. This can reduce the impact of price volatility. Similarly, scaling out allows you to lock in profits while leaving a portion of your position open to capture further gains.
- The Importance of Patience and Discipline in Risk Management
- Successful breakout and retest trading requires waiting for the right opportunities and adhering to your trading plan. Avoid the temptation to overtrade or deviate from your strategy based on emotions.
Implementing these risk management techniques can help traders navigate the challenges of breakout and retest trading more effectively, leading to better decision-making and improved overall performance.
Putting It All Together: Building Your Trading Plan
- Assessing Your Risk Tolerance: Before diving into the markets, it’s crucial to understand your personal risk tolerance. This involves gauging how much financial and emotional risk you can handle without it affecting your decision-making process. Knowing your risk tolerance helps in tailoring your trading strategy to align with your comfort level, ensuring you remain composed and rational under market pressures.
- Developing Clear Entry and Exit Rules: A successful trading plan must include predefined rules for when to enter and exit trades. Clear entry rules might be based on specific indicators, chart patterns, or conditions that signal a potential opportunity. Similarly, exit rules should define when to book profits or cut losses, providing a disciplined approach to trading and helping to manage risk effectively.
- Setting Realistic Profit Targets: Establishing realistic profit targets is essential for maintaining a grounded and long-term perspective in trading. These targets should be based on thorough market analysis, historical performance, and your risk-reward ratio. Setting achievable goals helps in measuring your performance and prevents the pursuit of unrealistic gains, which can lead to excessive risk-taking.
- Backtesting Your Strategies for Consistency: Backtesting involves applying your trading strategy to historical market data to see how it would have performed. This process is critical for assessing the viability and consistency of your trading approach. By backtesting, you can refine your strategy, adjust your risk management techniques, and gain confidence in your plan before applying it to the live markets.
Common Mistakes to Avoid in Breakout and Retest Trading
- Chasing Breakouts Without Confirmation: One of the frequent missteps traders make is entering a trade immediately after a breakout occurs, without waiting for confirmation. This impulsive action can lead to being caught in a false breakout, where the price quickly reverses direction. To mitigate this risk, traders should look for confirmatory signals such as a closing candle outside the breakout level or additional indicators aligning with the breakout direction.
- Ignoring Key Support and Resistance Levels: Overlooking established support and resistance levels can result in misjudging the breakout’s potential. These levels act as barriers to price movements, and a breakout’s failure to breach them might halt the expected trend before it fully develops. Traders should always consider these levels when planning entry and exit points to enhance their trading strategy’s effectiveness.
- Overlooking the Role of Volume: Volume is a critical validator of breakouts; however, traders often neglect its importance. A genuine breakout is usually accompanied by a significant increase in volume, indicating strong market participation. Low volume during a breakout suggests weak conviction, raising the likelihood of a false breakout. Assessing volume alongside price action can provide a more robust indication of breakout strength.
- Failing to Adapt to Changing Market Conditions: The financial markets are dynamic, and strategies that work under certain conditions may not perform well when those conditions change. Traders sometimes stick rigidly to their initial analysis or strategy, ignoring signs that market conditions have shifted. Being flexible and responsive to new information or market changes is crucial for successful breakout and retest trading, allowing traders to adjust their strategies to maintain alignment with current market dynamics.
⬇️You May Also Read ⬇️
➤6 Essential Investment Factors Every Beginner Should Know to evaluate investments
➤Your Secret Weapon for Tax Savings: House Rent Allowance (HRA) and Other allowances
➤Magic of the 8-4-3 Rule in Mutual Fund Investing
➤Mastering Income Tax savings: A Beginner’s Guide to Save Money Legally
➤Top 10 Powerful Reasons to Invest in Mutual Funds
FAQ: Mastering Breakout and Retest Concept in Trading
What are breakouts in trading?
Breakouts indicate a significant change in supply and demand dynamics, leading to the price of an asset moving above a predefined resistance level or below a predefined support level. They signal a shift in market sentiment, potentially starting a new trend in the direction of the breakout.
How do you recognize a breakout?
A breakout is recognized by a price movement above resistance or below support, usually accompanied by significant volume. Key points include understanding support and resistance levels, monitoring price movement, and looking for confirmation signals such as increased trading volume or price closing convincingly beyond the identified level.
What are retests in trading, and why are they important?
Retests occur when the price of an asset returns to the breakout level from the opposite direction, offering an opportunity to confirm the breakout’s strength and validity. They are crucial for confirming the role reversal of support and resistance levels, providing favorable entry or exit points, and managing risk.
Can you explain the role of human psychology in breakouts and retests?
Human emotions, particularly fear and greed, significantly influence market movements during breakouts and retests. Greed drives buying pressure in anticipation of further gains, while fear motivates selling to avoid losses. Understanding these psychological elements helps traders interpret market sentiment and price action more effectively.
How can traders identify breakout opportunities?
Identifying breakout opportunities involves analyzing technical indicators (e.g., moving averages, RSI, Bollinger Bands), recognizing chart patterns (e.g., triangles, flags, head and shoulders), and considering volume analysis to confirm the strength and validity of a breakout.
What is the breakout and retest trading strategy?
This strategy involves identifying support and resistance levels, waiting for a strong move past these levels, observing if the price retests the new level from the opposite direction, and then looking for confirmation that the price will continue in the direction of the initial breakout. It emphasizes the importance of confirmation and risk management.
How can traders manage risk in breakout and retest trading?
Effective risk management includes setting proper position sizes, using stop loss orders effectively, scaling in and out of trades, and maintaining patience and discipline. These techniques help protect gains, minimize losses, and navigate the challenges of breakout and retest trading.
What are common mistakes to avoid in breakout and retest trading?
Common mistakes include chasing breakouts without confirmation, ignoring key support and resistance levels, overlooking the role of volume, and failing to adapt to changing market conditions. Avoiding these pitfalls can enhance the effectiveness of breakout and retest trading strategies.
4 thoughts on “Trade with Confidence: Mastering Breakout and Retest Concept in Trading”