Hello , Traders- as you have learn about the Basic concept of Breakout and retest from our this Post –Trade with Confidence: Mastering Breakout and Retest concept in Trading. So, Please read this post before reading Breakout and retest trading strategy here.
Breakout and retest trading Concept
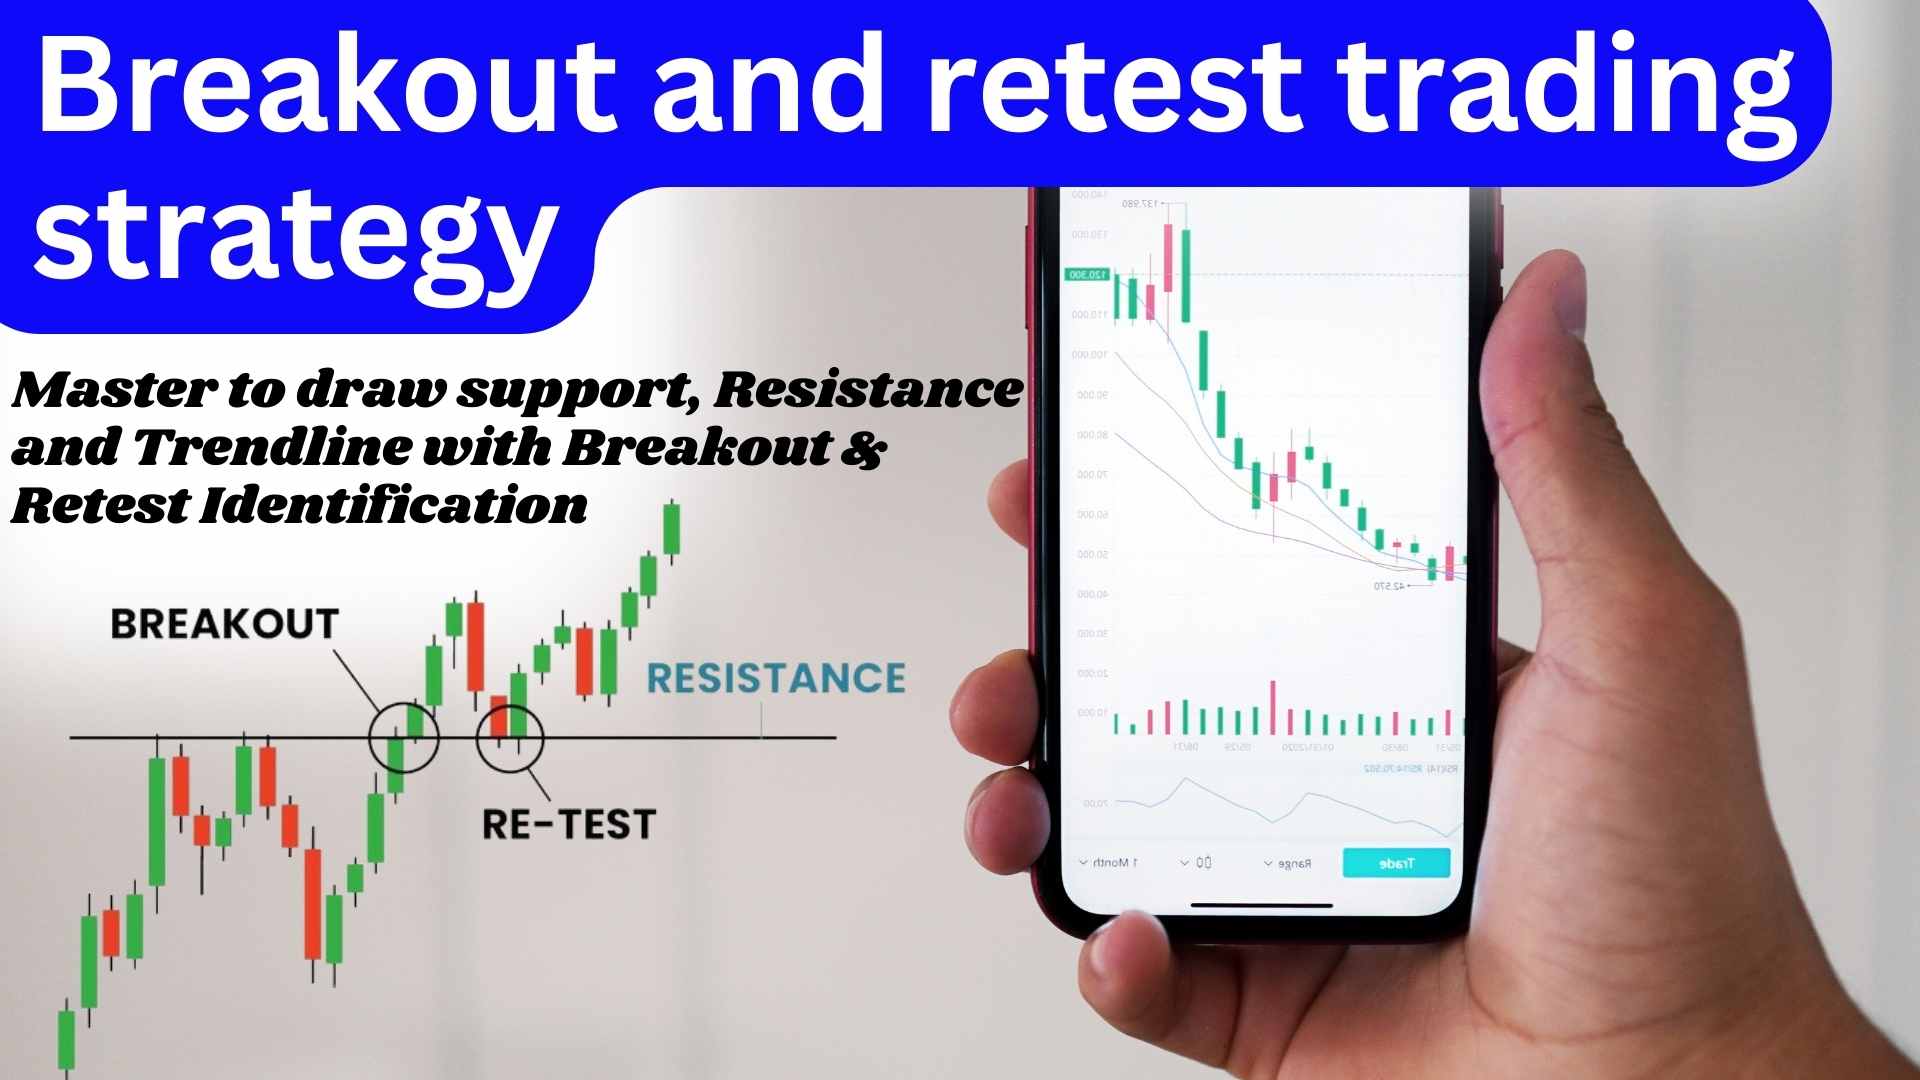
Breakout and retest trading is a strategy used in financial markets, particularly in trading stocks, forex, cryptocurrencies, and commodities. The strategy relies on identifying key levels of support and resistance on price charts.
A breakout occurs when the price of an asset moves above or below a significant level of support or resistance. This movement is often accompanied by increased trading volume and signifies a potential shift in market sentiment. Traders who employ the breakout strategy aim to capitalize on the momentum generated by such movements.
However, breakouts can sometimes be false signals, leading to losses for traders who enter positions too early. This is where the retest comes into play. After a breakout, the price may retrace back to the breakout level, now acting as support or resistance, before continuing in the direction of the breakout. Traders using the breakout and retest strategy look for confirmation of the breakout by waiting for a successful retest of the broken level before entering a trade.
To know in more details ,Please Read – https://investmindsetacademy.com/mastering-breakout-and-retest-concept/
in this post , I will Discuss about different Breakout and retest trading strategy
The breakout and retest strategy is popular among traders for several reasons:
- Clear Entry and Exit Signals: Breakouts and retracements provide clear entry and exit signals for traders. When a breakout occurs, it indicates a potential change in market direction, while a successful retest confirms the validity of the breakout, offering traders a precise entry point.
- Reduced Risk: By waiting for a retest confirmation, traders can reduce the risk of entering trades prematurely on false breakouts. The retest serves as a validation of the breakout, increasing the probability of a successful trade.
- Opportunity for High Returns: Breakout and retest trades have the potential for high returns, especially when the breakout occurs from a significant level of support or resistance. Traders can capture large price movements if the breakout leads to a sustained trend.
- Versatility: The breakout and retest strategy can be applied to various timeframes and markets, making it versatile for traders with different preferences and trading styles.
Characteristics of breakout patterns
Breakout patterns in trading are significant because they indicate a potential change in the market’s direction, offering opportunities for traders to enter or exit positions based on the new momentum. Understanding the characteristics of breakout patterns is crucial for identifying them early and making informed decisions. The main characteristics include price volatility, volume spikes, and key levels.
1. Price Volatility
- Definition: Price volatility refers to the degree of variation in the price of a security over time. In the context of breakout patterns, volatility often increases as the market anticipates a significant move.
- Role in Breakouts: Before a breakout, the price may consolidate within a narrow trading range, forming a pattern such as a triangle, rectangle, or flag. During this consolidation phase, volatility tends to decrease as traders await a significant price movement. The breakout itself is characterized by a sudden increase in volatility as the price moves sharply in a new direction. This sudden increase is a key characteristic of a breakout, indicating that the price is moving out of its previous trading range. So, Whenever breakout occurs, volatility spikes, indicating strong buying or selling pressure in the market. Traders often use volatility indicators such as Bollinger Bands, Average True Range (ATR), or standard deviation to measure price volatility. A sharp increase in volatility during a breakout suggests that market participants are actively reacting to new information or developments, potentially signaling a shift in market sentiment.
- Implications for Traders: High volatility during a breakout suggests strong interest in the security and the potential for a sustained new trend. Traders often look for increased volatility as confirmation that a breakout is likely to continue rather than revert back to its previous range.
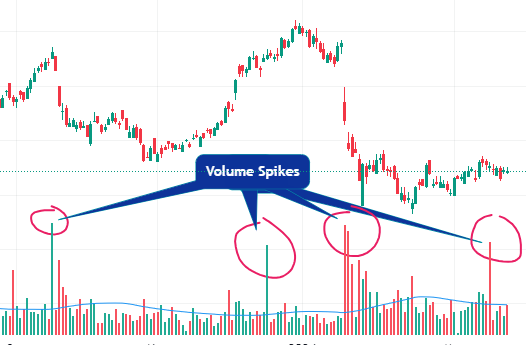
2. Volume Spikes
- Definition: Volume spikes are another characteristic feature of breakout patterns. Volume represents the total number of shares or contracts traded during a specific period. In breakout trading, volume plays a crucial role as it confirms the validity of the breakout and provides insight into the strength of market participation. A volume spike occurs when trading volume significantly exceeds its average, indicating a heightened level of trading activity.
- Role in Breakouts: A volume spike is a critical component of a valid breakout pattern. It provides confirmation that a significant number of traders are participating in the move, suggesting a strong consensus about the new direction of the price.
- Implications for Traders: Traders look for volume spikes as a sign of confirmation for a breakout. A breakout without a corresponding increase in volume might be seen as less reliable, as it suggests weaker conviction among market participants. Conversely, a breakout accompanied by high volume is more likely to represent a true shift in market sentiment.
- Traders often use volume indicators such as Volume Price Trend (VPT), On-Balance Volume (OBV), or Volume Weighted Average Price (VWAP) to analyze volume dynamics during breakouts. A sudden surge in volume following a breakout indicates widespread interest in the security, validating the breakout signal and providing confidence to traders.
3. Key Levels
- Definition: Key levels are specific price points on charts that are significant to the market’s movement. These can include previous highs or lows, round numbers levels, Resistance, Supports ,Trendlines or levels identified by technical analysis tools like Fibonacci retracement levels.
- Role in Breakouts: Breakouts often occur around key levels because these price points represent psychological barriers or points of significant supply and demand. A breakout through a key level indicates that the market sentiment has shifted sufficiently to overcome these barriers.
- Implications for Traders: Key levels serve as markers for traders to assess the strength and potential sustainability of a breakout. A breakout through a significant key level, especially if accompanied by high volatility and volume, is seen as a strong signal of a new market trend.
- Traders often place buy or sell orders above or below these key levels to capitalize on breakout opportunities, with stop-loss orders placed to manage risk in case of a reversal.

Understanding these characteristics helps traders identify breakout patterns with higher potential for success. By analyzing price volatility, volume spikes, and the significance of key levels, traders can make more informed decisions on when to enter or exit trades based on these powerful market signals.
Let’s understand – How can we identify breakout opportunity before learning and applying Breakout and retest trading strategy
Identification of Breakout Opportunities
Identifying breakout opportunities in trading and investing is a crucial skill for market participants, offering potential high-reward entry points. Breakouts typically occur when the price moves outside a defined price range or pattern, indicating a potential trend continuation or reversal. Understanding support and resistance levels, along with specific chart patterns that signal breakouts, is fundamental to use Breakouts and Retest strategy.
Breakouts can happen in two ways:
- Support and resistance levels breakouts
- Chart patterns signaling breakouts
A. Support and resistance levels breakouts
Support and resistance levels are foundational concepts in technical analysis, helping traders to identify potential points on a price chart where an asset’s price movement is likely to either pause or reverse. These levels act as psychological barriers in the minds of traders and investors. These levels are identified by analyzing historical price data and chart patterns.
Support and resistance levels are Two types
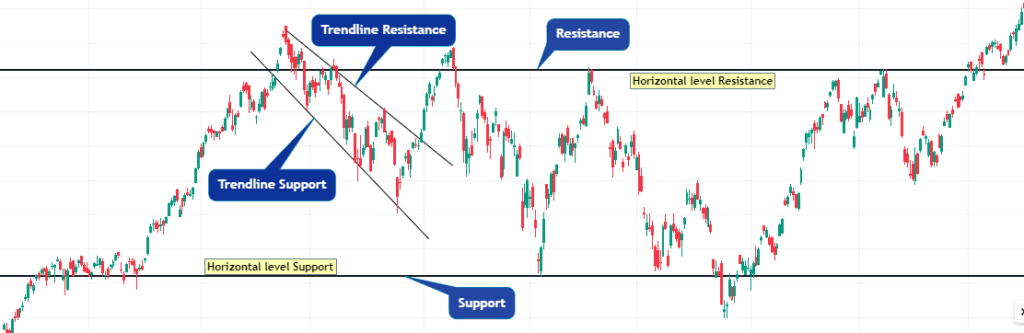
- Horizontal Levels
- Trendlines
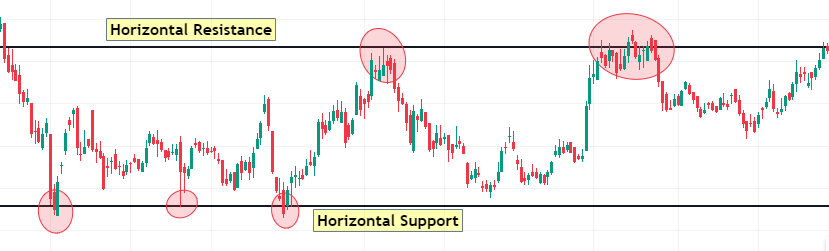
1. Horizontal Levels
- Support: A support level is a price level where a downtrend can be expected to pause due to a concentration of demand. As the price of an asset drops, demand for the asset increases, thus forming the support line. This is where buyers are anticipated to enter the market or increase their positions, leading to a bounce in price.
- Resistance: A resistance level is the opposite of a support level. It’s a price level where a trend can pause or reverse due to a concentration of selling. As the price of an asset rises, sellers begin to outnumber buyers, creating a ceiling that the price struggles to break through.
- Identification: Horizontal support and resistance levels are drawn on charts by connecting the highs or lows of price points where the price had previously reversed or paused. These levels represent psychological barriers to market participants and can be strong indicators of market sentiment.
- Sometime Horizontal support and resistance levels are drawn on round up numbers also act as strong Support or Resistance.
Breakouts from Horizontal Levels: When the price breaches a known resistance level, it could indicate the start of an uptrend, presenting a buying opportunity. Conversely, if the price falls below a support level, it might signal the beginning of a downtrend, suggesting a selling or short-selling opportunity.
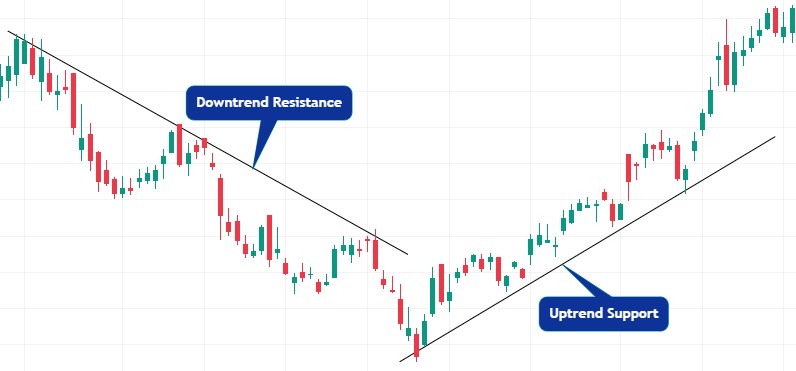
2. Trendlines
Trendlines are drawn on price charts to represent support and resistance but in a diagonal manner, indicating a trend’s direction (upward, downward, or sideways).
Unlike horizontal levels, trendlines are diagonal lines drawn on price charts that connect a series of highs or lows. Trendlines can act as support in uptrends by connecting the lows and as resistance in downtrends by connecting the highs. They show the direction of the price movement and the speed of the price change.
- Uptrend Line (Support): In an uptrend, a support trendline is drawn by connecting the lows (swing lows) of the price movement. This line projects future support levels where the price is likely to bounce off as it retraces down towards the line, suggesting a buying opportunity.
- Downtrend Line (Resistance): In a downtrend, a resistance trendline is drawn by connecting the highs (swing highs) of the price movement. This line projects future resistance levels where the price is likely to pull back as it moves up towards the line, suggesting a selling opportunity.
- Breakouts: A breakout occurs when the price moves beyond a trendline with significant volume. An upward breakout from a downtrend line or downward breakout from an uptrend line can signal a potential reversal in the price direction.
- Identification: To draw a trendline, you need at least two high points for resistance or two low points for support. The more points the line touches, the stronger and more significant the trendline becomes. Traders look for breakouts of these trendlines as potential trading opportunities, often accompanied by increased trading volume as confirmation.
Breakouts from Trendlines: A price moving above a downtrend line indicates a potential reversal from a downtrend to an uptrend. Similarly, a price dropping below an uptrend line can signal a reversal from an uptrend to a downtrend.
B. Chart patterns signaling breakouts
Chart patterns are formations within price charts indicating what the price of an asset might do next, based on past performance.
Identifying breakout opportunities in trading is a crucial aspect of technical analysis, where traders look for patterns on price charts that indicate potential future price movements. Breakouts with high volume in this patterns gives signal of potential shift in market sentiment. Among the various chart patterns that signal breakouts, some of the most common ones include triangles, rectangles, flags and pennants, and head and shoulders patterns.
Triangles:
Triangles are consolidation patterns that form when the price of an asset converges into a tighter and tighter range, creating a triangular shape on the chart. There are three main types of triangles: ascending triangles, descending triangles, and symmetrical triangles.
- Ascending triangles form when there is a horizontal resistance level and a rising trendline acting as support. Breakouts occur when the price moves above the resistance level. It’s considered a bullish signal, suggesting that the price is likely to break out upwards as the buyers gradually overcome the sellers.
- Descending triangles form when there is a horizontal support level and a descending trendline acting as resistance. Breakouts happen when the price breaks below the support level. It’s typically seen as a bearish signal, indicating that the price may break out downwards as sellers pressure the buyers.
- Symmetrical triangles occur when the price forms converging trendlines without a clear bias. Breakouts can happen in either direction, depending on which trendline is breached. So, The direction of the breakout will determine the market’s next move.
Rectangles:
Rectangles are consolidation patterns characterized by parallel horizontal lines acting as support and resistance. These patterns indicate a period of indecision in the market, with buyers and sellers closely matched. Breakouts occur when the price breaks above the resistance or below the support level with significant volume.
- Flags and Pennants: Flags and pennants are short-term continuation patterns that typically occur after a strong price movement, known as the flagpole. Flags are rectangular-shaped consolidation patterns, while pennants are small symmetrical triangles.
- Flags form when the price consolidates in a narrow range after a sharp upward or downward movement. Breakouts occur when the price resumes its previous trend in the direction of the flagpole.
- Pennants are similar to flags but have a smaller and more symmetrical shape. Breakouts happen when the price breaks out of the pennant pattern, often with increased volume.
Head and Shoulders:
The head and shoulders pattern is a reversal pattern that typically forms after an uptrend and signals a potential trend reversal to the downside. It consists of three peaks: a higher peak (head) between two lower peaks (shoulders). The neckline acts as support, and a breakdown below this level confirms the pattern.
- The left shoulder forms as the price reaches a peak during an uptrend, followed by a decline and a subsequent rise forming the head.
- The right shoulder forms as the price peaks again but fails to reach the height of the head. A breakdown below the neckline after the formation of the right shoulder confirms the pattern and signals a potential downtrend.
- Inverse Head and Shoulders: The inverse or bottom head and shoulders pattern indicates the opposite: the end of a downtrend and the beginning of an uptrend. The neckline acts as resistance, and a breakout above this level confirms the reversal.
Recognizing these patterns on a chart requires practice and experience. Traders often use additional technical indicators or fundamental analysis to strengthen their conviction in the potential breakout direction and manage risk effectively.
When identifying breakout opportunities using these chart patterns, traders typically look for confirmation signals such as increased volume accompanying the breakout, as it suggests strong market participation and validates the significance of the breakout.
Key Indicators for Breakout Trading
Breakout trading is a strategy where traders enter the market as early as possible in a trend, aiming to capture the momentum before the rest of the market catches on.
To identify these breakout opportunities, traders rely on Support and resistance levels breakouts and Chart patterns signaling breakouts as discussed above, But before entry into the trade , Trader do more confirmation of breakout Signal with the help of various technical indicators that help predict when a stock is about to make a significant move. Below, we delve into some of the key indicators used in breakout trading:
A. Moving Averages
Moving averages smooth out price data to create a single flowing line, making it easier to identify the direction of the trend. There are different types of moving averages, each with its own calculation method. The two most commonly used in breakout trading are:
1. Simple Moving Average (SMA)
- Definition: The SMA is calculated by adding up the closing prices of a stock over a certain number of periods (e.g., 20 days) and then dividing this total by the number of periods. This gives a straightforward average of the price over the selected time frame.
- Breakout Indicator: A breakout might be identified when the price of a stock moves above a significant SMA (such as the 50-day or 200-day). This could indicate that the momentum is shifting, and a new trend may be starting. Conversely, a move below a significant SMA might indicate a potential downtrend.
2. Exponential Moving Average (EMA)
- Definition: The EMA gives more weight to the most recent prices, which makes it more responsive to new information compared to the SMA. This is achieved through a more complex formula that incorporates the previous period’s EMA.
- Breakout Indicator: Similar to the SMA, traders might consider a price moving above a key EMA level as a potential breakout to the upside, suggesting that the stock could be entering a bullish phase. A move below a key EMA level might signal a possible bearish phase.
B. Relative Strength Index (RSI)
- Definition: The RSI is a momentum oscillator that measures the speed and change of price movements on a scale of 0 to 100. Generally, an RSI above 70 indicates a stock is overbought, while an RSI below 30 suggests it is oversold.
- Breakout Indicator: In breakout trading, an RSI moving back from overbought or oversold conditions can signal the start of a new trend. For instance, an RSI rising above 30 might indicate a potential breakout from a bearish to a bullish trend, while an RSI dropping below 70 could suggest a shift from a bullish to a bearish trend.
C. Average True Range (ATR)
- Definition: The ATR measures market volatility by decomposing the entire range of an asset for that period. It takes into account the range between the high and low prices, as well as any gaps in the price movement from one period to the next.
- Breakout Indicator: The ATR can help traders identify breakout opportunities by highlighting increases in volatility, which often accompany the beginning of a new trend. A sudden increase in the ATR following a period of consolidation could suggest that a significant price movement is about to occur.
These indicators provide critical insights into market conditions and help identify potential breakout opportunities. However, it’s important for traders to use them in conjunction with other analysis tools and consider the broader market context to improve the accuracy of their predictions. Remember, no indicator can provide guaranteed results, so risk management and due diligence are crucial components of successful trading strategies.
Now ,Lets understand Retest Before Understand Strategy.
Retest and Its Implication
What is a Retest?
In the context of financial markets, a retest refers to the phenomenon where the price of a security revisits a specific level after initially moving away from it. This level can be a support or resistance level that has been previously established. A retest occurs in two main scenarios:
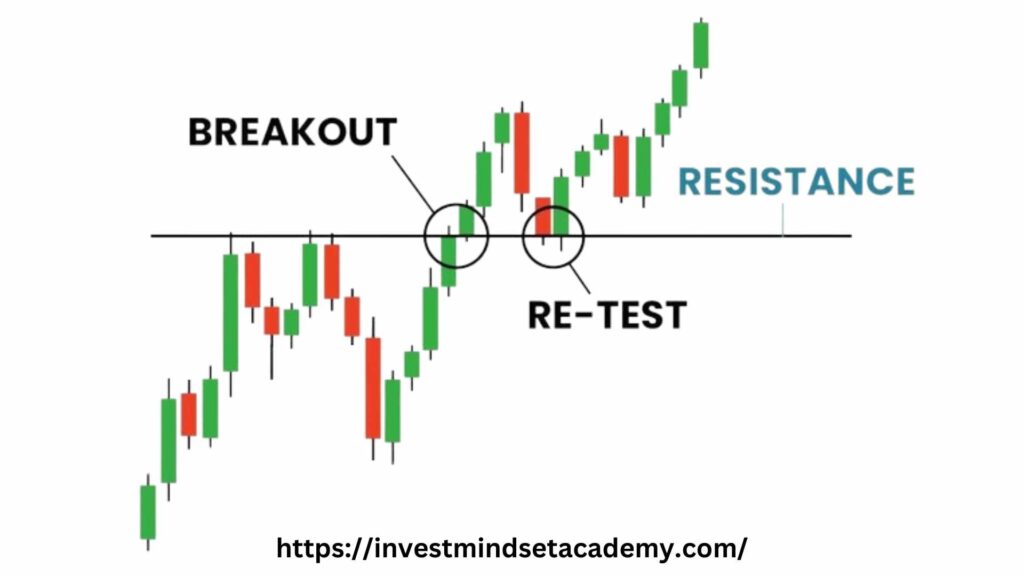
- After a Breakout: When a price breaks through a significant level of resistance or support, it often moves away from that level. A retest happens if the price then turns around and comes back to test that level again. This is crucial because it can confirm the validity of the breakout.
- Within a Range: Sometimes, prices fluctuate within a certain range, touching and retreating from the range’s support and resistance levels multiple times. A retest in this scenario would be the price moving back to touch these established boundaries.
Significance of Retesting Prior Breakout Levels
Retesting is significant for several reasons, especially after a price has broken out of a previous resistance or support level:
- Confirmation of the Breakout: A retest offers confirmation that the breakout is genuine. It’s not uncommon for prices to break a level momentarily before reversing direction, known as a “false breakout.” A successful retest, where the price does not fall back through the breakout level, suggests that the initial breakout was valid.
- Establishing New Support or Resistance: When a breakout level is retested successfully, it often transforms into a new level of support or resistance. For example, if the price of a stock breaks above a resistance level and then comes back to retest it from the other side without breaking below, that resistance level becomes a new level of support.
- Psychological Confirmation: Markets are driven by the psychology of traders and investors. A successful retest and bounce off a new support or resistance level can boost confidence in the prevailing trend, encouraging more participants to join, which can further fuel the move.
How to Identify a Retest Opportunity
Identifying a retest opportunity involves several steps and considerations:
- Identify Significant Levels: The first step is to identify key support and resistance levels. These can be historical price levels where the asset has previously turned around or levels indicated by technical indicators such as moving averages, Fibonacci retracement levels, or pivot points.
- Watch for a Breakout: Monitor these levels for a potential breakout. A breakout is a strong move above a resistance level or below a support level on increased volume.
- Wait for the Retest: After a breakout, wait for the price to come back to test the newly established support or resistance level. This is your potential retest.
- Look for Confirmation Signals: During the retest, look for confirmation signals that the level is holding. These can include candlestick patterns like hammers or engulfing patterns, indicators such as the Relative Strength Index (RSI) showing oversold conditions at a support retest, or simply an increase in volume as the price bounces off the level.
- Risk Management: Always consider risk management. Not every retest results in a continuation of the initial breakout trend. Set stop-loss orders below the new support or above the new resistance to protect against losses if the retest fails.
Retest opportunities, when identified and executed correctly, can provide traders with high-probability trading setups. They allow for clear risk/reward setups and offer additional confirmation that can help traders make more informed decisions.
Breakout and Retest Strategy
The “Breakout and Retest Strategy” is a popular trading technique used in financial markets to identify potential entry and exit points based on price movements breaking through established support or resistance levels, followed by a retest of these levels. This strategy is widely used across different markets such as forex, stocks, and commodities. Here’s a detailed explanation of its components:
The breakout and retest trading strategy involves:
- Identify Levels: Spot significant support and resistance levels on the price chart.
- Wait for Breakout: Wait for a breakout, either above resistance or below support.
- Retest Confirmation: After the breakout, await the price to retest the broken level.
- Confirm Retest: Look for confirmation that the retest is holding, such as bullish price action above former resistance turned support or bearish price action below former support turned resistance.
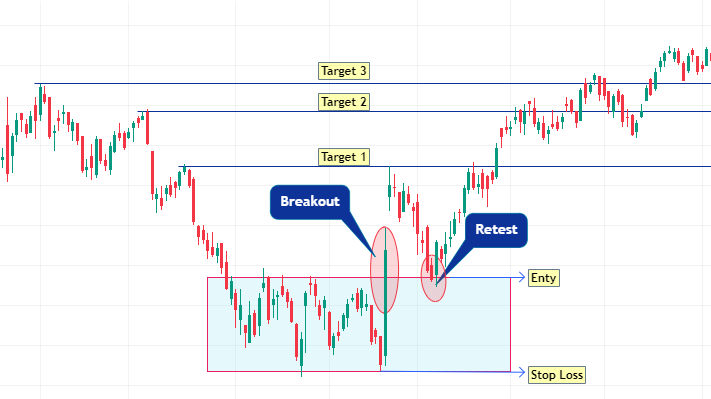
- Enter Trade: Enter a trade in the breakout direction, with risk management like stop-loss orders.
- Monitor and Adjust: Monitor the trade, adjust stop-loss orders or take profits based on further price movement and market conditions.
This strategy is grounded in the belief that breakouts from significant levels can lead to strong and sustained price movements. Retests offer an opportunity to enter trades with lower risk and higher probability of success. However, it carries inherent risks, necessitating thorough analysis and proper risk management.
Here’s a detailed explanation of its components:
A. Entry Points for Breakout and Retest Trades
Breakout Phase:
- The breakout occurs when the price moves beyond a defined support or resistance level with increased volume. These levels are areas where the price has historically struggled to move past.
- Traders look for a decisive move beyond this level as confirmation of a breakout. Increased trading volume is often seen as additional confirmation.
Retest Phase:
- After a breakout, prices often return to the breakout level in a “retest”. This retest serves to confirm the new support or resistance level.
- The retest phase is crucial for traders using this strategy as it provides a second chance to enter the trade with more confirmation that the breakout is legitimate.
- Entry points are typically identified during or after the retest phase when the price moves off the retested level in the direction of the original breakout.
B. Setting Stop-Loss and Take-Profit Levels
Stop-Loss:
- A stop-loss is set just beyond the retested level (opposite to the breakout direction) to minimize potential losses if the breakout fails. For example, in a bullish breakout, the stop-loss would be set just below the retested support level.
- The stop-loss placement is crucial to manage risk and should be determined based on the volatility of the trading instrument and the trader’s risk tolerance.
Take-Profit:
- Take-profit levels are typically set based on previous price levels that could act as resistance (in a bullish breakout) or support (in a bearish breakout).
- Traders may also use a fixed risk-reward ratio (e.g., 2:1, 3:1) to set their take-profit level, aiming for a profit that is multiples of the risk taken.
C. Risk Management Considerations
Risk per Trade:
- Traders should determine how much of their total capital they are willing to risk on a single trade, often recommended to be between 1% to 3%. This helps in managing the overall risk exposure.
Position Sizing:
- Position size should be calculated based on the distance from the entry point to the stop-loss level, ensuring that if the stop-loss is triggered, the loss does not exceed the predetermined risk per trade.
Diversification:
- Applying the breakout and retest strategy across multiple instruments can help diversify risk. However, traders must be cautious about correlations between these instruments which might increase risk instead of diversifying it.
Market Conditions:
- The effectiveness of the breakout and retest strategy can vary depending on market conditions. It tends to perform better in trending markets than in range-bound or choppy markets.
Using the breakout and retest strategy involves careful planning and discipline. Entry and exit points must be clearly defined, and risk management rules must be strictly followed to ensure long-term success. Additionally, continuous learning and adaptation to changing market conditions are essential components of effectively using this strategy.
If you want to know in more details about Breakout and Retest strategy with practical example in Chart and How to do extra confirmation of breakout and Retest with help of chart Pattern and Indicator , Please read this post –>.Coming Soon
Breakout and Retest Trading Strategy FAQ
What is a breakout in trading?
A breakout occurs when the price of an asset moves beyond a significant level of support or resistance, often with increased trading volume. It indicates a potential shift in market sentiment and the start of a new trend.
What is a retest in trading?
After a breakout, a retest occurs when the price moves back to the breakout level, now acting as new support or resistance, before continuing in the direction of the breakout. This serves as a confirmation of the breakout’s validity.
Why is the breakout and retest strategy popular among traders?
The strategy provides clear entry and exit signals, reduces risk by confirming breakouts through retests, offers the potential for high returns, and can be applied across various markets and timeframes.
What are the main characteristics of breakout patterns?
Breakout patterns are characterized by increased price volatility, volume spikes, and occur around key levels of support or resistance. These patterns indicate a potential change in the market’s direction.
How can traders identify breakout opportunities?
Traders can identify breakout opportunities by analyzing support and resistance levels, including horizontal levels and trendlines, and recognizing specific chart patterns like triangles, rectangles, and head and shoulders.
What are some key indicators for breakout trading?
Key indicators include Moving Averages (SMA and EMA), the Relative Strength Index (RSI), and the Average True Range (ATR). These help in predicting potential breakouts and confirming their strength.
How significant is a retest after a breakout?
A retest is significant as it confirms the breakout’s validity, establishes new support or resistance levels, and provides psychological confirmation to market participants, reinforcing the trend.
What steps are involved in the breakout and retest trading strategy?
The strategy involves identifying significant levels, waiting for a breakout, confirming the retest, entering a trade in the breakout direction, and managing the trade with appropriate risk management techniques.
What risk management techniques should be used with this strategy?
Risk management techniques include setting stop-loss orders to protect against losses if the retest fails, monitoring trades, and adjusting orders based on market conditions and price movements.
Can the breakout and retest strategy be applied to all markets?
Yes, the breakout and retest strategy is versatile and can be applied to stocks, forex, cryptocurrencies, and commodities, across different timeframes.
2 thoughts on “Mastering Breakout and retest trading strategy”