
It is important for anyone interested in investing in the stock market, especially beginners, to understand stock market terminology. The stock market can seem like a daunting place, full of jargon that can be difficult to navigate without a basic understanding of the terms used. This knowledge is not just academic; This is practical and can have a significant impact on the decisions made by the investor, potentially affecting the returns on their investment. By familiarizing themselves with the language of the financial markets, beginners can navigate the complexities of investing, making the stock market more accessible and less intimidating.

Importance of Understanding Stock Market Terminology
- Informed Decision-Making: Knowledge of stock market terminology empowers investors to make informed decisions. Understanding terms like “dividends,” “P/E ratio,” and “market capitalization” enables investors to analyze and evaluate stock performance and potential investment opportunities more effectively.
- Effective Communication: Being conversant in the language of the stock market facilitates clearer communication with financial advisors, brokers, and fellow investors. This can be crucial when seeking advice or making investment decisions.
- Confidence Building: Knowledge dispels fear. By understanding stock market terminology, beginners can gain confidence in their ability to engage with the market. This confidence can encourage participation in investing, which is a key step towards financial empowerment.
- Risk Management: Understanding terms related to risk, such as “volatility,” “beta,” and “diversification,” can help investors manage and mitigate potential losses. Knowledge of these concepts allows for the development of strategies that align with an investor’s risk tolerance and financial goals.
How This Guide Helps
This guide is designed to serve as a bridge between beginners and the stock market by:
- Breaking Down Complex Terms: It simplifies complex financial jargon into understandable language, using examples and analogies where possible. For instance, explaining “bear” and “bull” markets through market trends can help visualize what these terms mean in practice.
- Providing Context and Examples: For each term, the guide offers context on where and how it is used, along with examples that illustrate its application. For example, explaining the “P/E ratio” by comparing two companies within the same industry can demonstrate how investors use this metric to evaluate stock value.
- Categorizing Information: The guide organizes terminology into categories (e.g., trading terms, market indices, investment strategies), making it easier to navigate and understand how different concepts relate to each other.
- Encouraging Active Learning: By presenting information in a structured and engaging manner, the guide encourages readers to actively learn and explore further. It can serve as a foundation for deeper study into each topic.
For beginners, understanding stock market terminology is a stepping stone towards successful investing. This guide aims to demystify the language of the stock market, making it more accessible and less daunting. By equipping readers with the knowledge of key terms and concepts, it lays the groundwork for informed decision-making, effective communication, and confidence in navigating the financial markets.
By understanding stock market terminology, beginners can embark on their investment journey with greater confidence and competence, setting a solid foundation for long-term financial success.
Basics of Stock Market Terminology
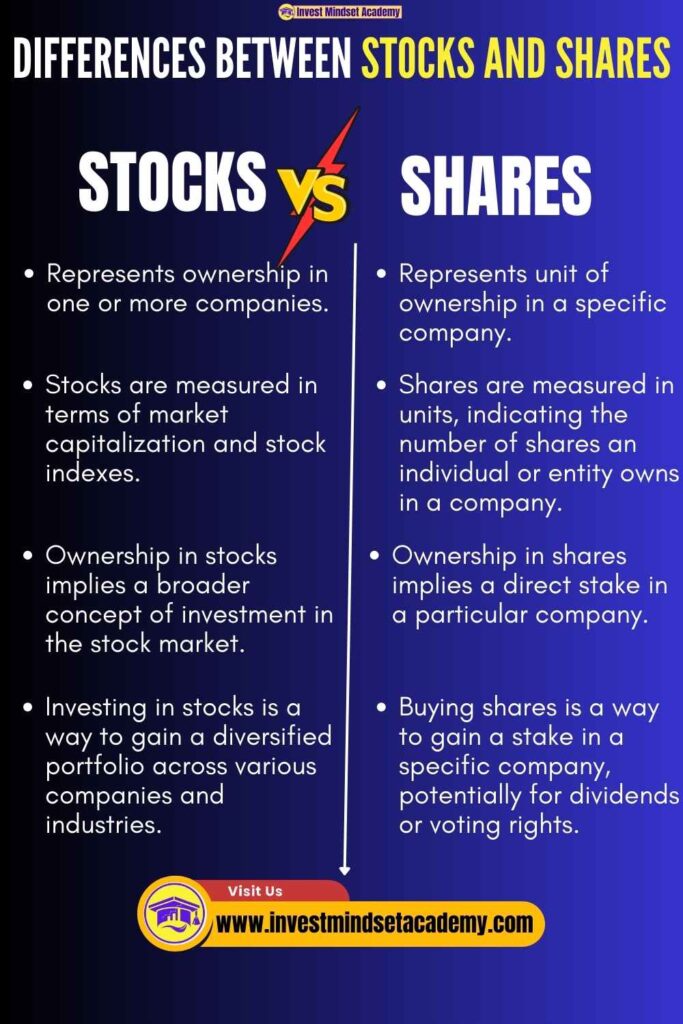
Stocks and Shares:
Stocks, also known as shares or equities, represent ownership in a company. When you buy a stock, you are essentially purchasing a small piece of ownership in that company. This ownership entitles you to certain rights, such as voting on corporate decisions and receiving a portion of the company’s profits in the form of dividends.
Example: Let’s say Company XYZ has issued 1,000 shares of stock. If you buy 100 shares of Company XYZ, you effectively own 10% of the company. As a shareholder, you may attend shareholder meetings, vote on important company decisions, and receive dividends if the company distributes them.
Bull and Bear Markets:
Bull and bear markets are terms used to describe the overall direction of the stock market.
Bull Market:
- A bull market is characterized by rising stock prices over an extended period, typically accompanied by investor optimism, strong economic indicators, and increasing corporate profits.
- In a bull market, investors are confident that the upward trend will continue, leading to higher buying activity.
- Example: During a bull market, stock prices may steadily rise over several months or even years. Investors may feel more inclined to buy stocks, anticipating further gains, which can drive prices even higher.
Bear Market:
- A bear market refers to a prolonged period of declining stock prices, often accompanied by widespread pessimism, economic downturns, and falling corporate profits.
- In a bear market, investors are cautious or pessimistic about the market’s future performance, leading to higher selling activity.
- Example: In a bear market, stock prices may experience significant declines, with major stock indices falling by 20% or more from their recent highs. Investors may sell their stocks to minimize losses or avoid further declines, contributing to the downward trend.
Dividends:
Dividends are payments made by a company to its shareholders out of its profits. They are typically distributed regularly, either quarterly, semi-annually, or annually, and are usually paid in cash. Dividends are a way for companies to share their profits with shareholders and provide them with a return on their investment.
Example: Company ABC announces a dividend of ₹5 per share. If you own 100 shares of Company ABC, you would receive a dividend payment of ₹500 (₹5 x 100 shares). Dividends can be a source of passive income for investors and can contribute significantly to the total return on investment.
Understanding these basic concepts is crucial for anyone looking to invest in the stock market. Stocks and shares represent ownership in a company, bull and bear markets indicate the overall market direction, and dividends provide a way for investors to earn income from their investments.
⬇️You May Also Read ⬇️
➤Top 10 Powerful Reasons to Invest in Mutual Funds
➤Mastering Your Finances: The Ultimate Guide to Saving and Investing Smartly
➤Understanding Calculation of NAV, Sale and Repurchase Price in Mutual Funds: A Simple Guide
Trading related the Stock Market terminology
Buy and Sell Orders
In the stock market, investors place buy and sell orders through brokerage firms or online trading platforms. These orders come in various types, each serving different purposes:.
Market Orders:
- These orders are executed immediately at the current market price.
- A market order is an instruction to buy or sell a security at the prevailing market price. It prioritizes execution speed over price.
- When an investor places a market order, they accept whatever the current market price is.
- For Example, if an investor wants to buy 100 shares of a company’s stock at the market price, the order will be executed immediately at the best available price. i.e. if Infosys is trading at ₹1,450 and you place a market buy order, you’ll purchase Infosys shares at the nearest available price around ₹1,450.
Limit Orders:
- Limit orders set the maximum or minimum price at which you’re willing to buy or sell a stock.
- A limit order is an instruction to buy or sell a security at a specific price or better.
- Unlike market orders, limit orders give investors more control over the price at which their trades are executed.
- Limit Order Generally used, if an investor wants to purchase shares of a company but only at a certain price, they can place a limit order specifying that price. The order will only be executed if the market price reaches or surpasses the specified limit price.
- Example – If you place a buy limit order for TCS shares at ₹3,200, your order will only be executed at ₹3,200 or lower. This gives you control over the price but does not guarantee execution if the stock never reaches your specified price.
Stop-Loss Orders:
- A stop-loss order becomes a market order once the stock reaches a specified price, known as the stop price.
- A stop-loss order is designed to limit an investor’s loss on a position. so, It’s used to limit potential losses.
- It is an order placed to sell a security once it reaches a certain predetermined price level.
- For Example, if an investor owns shares of a company that they bought at Rs. 100 per share and wants to limit potential losses, they can place a stop-loss order at Rs. 90 per share. If the stock price falls to Rs. 90 or below, the stop-loss order will trigger a market sell order, helping the investor limit their losses.
Bid and Ask
Bid and Ask prices play a crucial role in determining the current price of a security. The bid and ask are two sides of stock pricing that represent the highest price a buyer is willing to pay (bid) and the lowest price a seller is willing to accept (ask). :
Bid Price:
- The bid price represents the maximum price that a buyer is willing to pay for a security at a given point in time. This is the price at which buyers line up to buy shares.
- Example, if the current bid price for a stock is Rs. 150, it means that there are buyers willing to purchase the stock at Rs. 150 per share.
Ask Price:
- The ask price, also known as the offer price. It is the minimum price at which a seller is willing to sell a security. This is the price at which sellers line up to sell their shares.
- For example, if the current ask price for a stock is Rs. 155, it means that sellers are willing to sell the stock at Rs. 155 per share.
Spread:
- The difference between the bid and ask prices is known as the bid-ask spread or Spread.
- It represents the cost of executing a trade and can vary depending on market conditions and liquidity.
- A narrower spread often indicates a more liquid (easily traded) stock, whereas a wider spread can indicate less liquidity.
Volume
Volume or Trading volume refers to the total number of shares or contracts traded in a security or market over a given period. In the stock market, trading volume is a key indicator of market activity and liquidity. Here’s how it impacts stock prices:
Increased Volume (High Volume) :
- High trading volume often indicates increased investor interest and participation in a particular stock.
- When the volume is high, it suggests that there is significant buying or selling pressure, which can lead to significant price movements.
- For example, If Tata Motors shares have a trading volume of 10 million shares for the day, it indicates high interest and activity in Tata Motors. High volume often correlates with significant price movements, either up or down.
Decreased Volume ( Low Volume):
- Low trading volume may suggest reduced investor interest or lack of liquidity in a stock.
- Stocks with low trading volume are often considered illiquid, making it difficult to buy or sell large quantities without significantly impacting the stock price.
- Low volume can also signal indecision or a lack of conviction among investors.
- For Example: if a stock has a trading volume of 1,000 shares for the day, it indicates low interest, which can lead to price volatility due to the lack of buyers and sellers.
Trading volume can have a direct impact on stock prices. In general, a large increase in trading volume accompanied by a price increase suggests bullish sentiment, while a large increase in volume accompanied by a price decrease suggests bearish sentiment. However, it’s essential to consider other factors such as market news, company fundamentals, and technical analysis indicators when interpreting trading volume.
Note: Volume is a crucial indicator for traders and investors. High volume in the direction of the trend can confirm the trend’s strength, while high volume against the trend may signal a potential reversal.
Example in Context
Consider an example where you want to buy shares of Bharat Electronics Limited (BEL). The current bid price is ₹180, and the ask price is ₹181, with a trading volume of 5 million shares for the day. You decide to place a limit buy order at ₹180.5. If your order is executed, you’ve successfully purchased BEL shares slightly above the highest bid but below the asking price, potentially benefiting from a narrower spread and high volume, indicating active interest in BEL shares.
Understanding these trading terms and how they interact can significantly enhance your ability to navigate the stock market, making more informed decisions based on market dynamics.
⬇️You May Also Read ⬇️
➤Understanding the New Mutual Fund NAV Rules of Cut-off Timings
➤Understanding Financial Goals and Planning: A Guide to Smart Investments
➤Understanding Calculation of NAV, Sale and Repurchase Price in Mutual Funds: A Simple Guide
Market Indices and Measurement related Stock Market Terminology
Market Indices
Market indices are statistical measures that track the performance of a basket of selected stocks to represent a particular market or sector. These indices provide a snapshot of market trends and are used by investors to compare the performance of their investments.
Here are some key market indices:
Nifty 50
- The Nifty 50 is a major stock market index representing the weighted average of 50 of the largest Indian companies listed on the National Stock Exchange (NSE).
- It covers 13 sectors of the Indian economy and serves as a benchmark for the overall market performance.
- For example, if the Nifty 50 is up, it generally indicates that the Indian stock market, particularly the top 50 firms, is performing well.
Bank Nifty
- Bank Nifty, also known as Nifty Bank, tracks the performance of 12 of the most liquid and large capital Indian banking stocks trading on the NSE.
- It provides investors with insight into how the banking sector is performing, which is crucial since the banking sector often reflects the overall health of the economy.
Dow Jones Industrial Average (DJIA)
- The Dow Jones Industrial Average is one of the oldest and most well-known stock indices in the United States.
- It consists of 30 large, publicly-owned companies based in the United States and represents the performance of the industrial sector of the American stock market.
NASDAQ Composite
- The NASDAQ is a global electronic marketplace for buying and selling securities, but it is also a benchmark index for U.S. technology stocks.
- The NASDAQ Composite includes more than 3,000 stocks that are listed on the NASDAQ stock exchange, including major companies in the tech industry like Apple, Amazon, and Google’s parent company, Alphabet.
Market Capitalization
Market Capitalization, or “market cap,” refers to the total market value of a company’s outstanding shares of stock. It is calculated by multiplying the company’s share price by its total number of outstanding shares. Market cap is a significant measure because it gives investors an idea of the company’s size as well as the risk and return characteristics involved in investing in its stock. company’s size.
- Small-Cap: Companies with a market cap of less than Rs 5,000 crore. These are typically younger companies or in niche markets and can offer high growth potential but with higher risk.
- Mid-Cap: Companies with a market cap between Rs 5,000 crore and Rs 20,000 crore. These companies are in the process of expanding. They offer a balance between the risk and growth potential.
- Large-Cap: Companies with a market cap of over Rs 20,000 crore. These are well-established companies in their industries and offer stable returns with lower risk.
Market Measurements Related stock market terminology
1. P/E Ratio
- The Price-to-Earnings (P/E) Ratio is a widely used metric to value a company.
- It is calculated by dividing the company’s share price by its earnings per share (EPS).
- A high P/E ratio could mean that a company’s stock is over-valued, or investors are expecting high growth rates in the future. Conversely, a low P/E ratio might indicate that the company is undervalued or experiencing difficulties.
- For example, if Company A has a share price of ₹100 and an EPS of ₹10, its P/E ratio would be 10. This means investors are willing to pay ₹10 for every ₹1 of earnings.
2. Return on Equity (ROE):
- This measures a company’s profitability by revealing how much profit a company generates with the money shareholders have invested.
- It is calculated as Net Income divided by Shareholder’s Equity.
3. Price-to-Book Ratio (P/B Ratio):
- This ratio compares a company’s market capitalization to its book value.
- It is calculated by dividing the current closing price of the stock by the latest quarter’s book value per share.
- It helps investors determine if a stock is undervalued or overvalued based on its assets.
4. Dividend Yield:
- This measurement indicates how much a company pays out in dividends each year relative to its stock price.
- It is calculated as an annual dividend per share divided by the price per share. It’s a useful metric for income-seeking investors.
4. Beta:
- Beta measures a stock’s volatility in relation to the overall market.
- A beta greater than 1 indicates that the stock is more volatile than the market, while a beta less than 1 suggests that the stock is less volatile.
Investment Strategies related stock market terminology
Value vs. Growth Investing:
- Value Investing: Value investing is a strategy where investors look for stocks that are trading below their intrinsic value. These stocks are often considered undervalued by the market and have the potential to provide higher returns when their true value is recognized.
- Growth Investing: Growth investing, on the other hand, focuses on companies that exhibit strong growth potential in terms of earnings, revenue, or other key metrics. Investors in growth stocks are willing to pay a premium for the expectation of future growth.
Difference between Value Investing and Growth Investing:
- Value Investing: Value investors typically seek out companies with solid fundamentals but are currently undervalued by the market. They look for stocks with low price-to-earnings (P/E) ratios, low price-to-book (P/B) ratios, or high dividend yields. These investors believe that over time, the market will recognize the true value of these companies, leading to capital appreciation.
- Example: Warren Buffett is a famous value investor known for his approach of buying undervalued companies with strong competitive advantages.
- Growth Investing: Growth investors prioritize companies with high potential for future growth, even if their current valuation metrics might seem expensive. They focus on companies with innovative products or services, expanding market share, and strong earnings growth prospects.
- Example: Tech companies like Amazon or Tesla are often favored by growth investors due to their rapid revenue growth and disruptive business models.
Portfolio Diversification:
Definition:
- Portfolio diversification is a risk management strategy that involves spreading investments across various asset classes, industries, and geographic regions. The goal is to reduce the overall risk of the portfolio by not putting all eggs in one basket.
- Diversification can help mitigate the impact of adverse events on individual investments, as losses in one asset class may be offset by gains in another.
Importance:
- Diversification helps investors achieve a balance between risk and return. By spreading investments across different asset classes, investors can reduce the risk of significant losses while still potentially benefiting from overall market growth.
- It also helps in smoothing out portfolio volatility over time, making it easier for investors to stay invested during market downturns.
Example:
- Suppose an investor puts all their money into a single technology stock. If that company faces regulatory issues or experiences a decline in demand for its products, the investor’s entire portfolio could suffer significant losses. However, if the investor had diversified their portfolio to include stocks from various sectors such as healthcare, consumer goods, and utilities, the impact of any single company’s poor performance would be mitigated.
Long-Term vs. Short-Term Investing:
Definition:
- Long-Term Investing: Long-term investing involves buying and holding assets for an extended period, typically years or decades. The focus is on the fundamental strength of the investments and their potential for growth over time.
- Short-Term Investing: Short-term investing, also known as trading, involves buying and selling assets within a relatively short timeframe, often days, weeks, or months. Short-term investors aim to capitalize on short-term price fluctuations to generate quick profits.
Differences and Benefits:
- Long-Term Investing: Long-term investing allows investors to benefit from the power of compounding over time. By holding investments for the long term, investors can ride out market volatility and take advantage of the overall upward trend of the market. Long-term investing also incurs lower transaction costs compared to frequent trading.
- Benefits: Potential for higher returns, reduced transaction costs, lower tax implications (long-term capital gains tax rates are generally lower than short-term capital gains tax rates).
- Short-Term Investing: Short-term investing offers the potential for quick profits by taking advantage of short-term price movements. However, it requires active monitoring of the market and carries higher transaction costs and tax implications.
- Benefits: Ability to capitalize on short-term market fluctuations, flexibility to adapt to changing market conditions, potential for quick liquidity.
Example:
- A long-term investor may buy shares of a stable, dividend-paying company and hold them for several years, reinvesting dividends along the way. Over time, the investor benefits from both dividend income and capital appreciation as the company grows.
- In contrast, a short-term investor may engage in day trading, buying and selling stocks multiple times within a single trading day to profit from intraday price movements. This strategy requires constant monitoring of market conditions and carries higher risk due to the short holding period.
By understanding and applying these investment strategies, investors can make informed decisions that align with their financial goals and risk tolerance.
Now, Lets Learn More Stock Market Terminology which is very common to use.
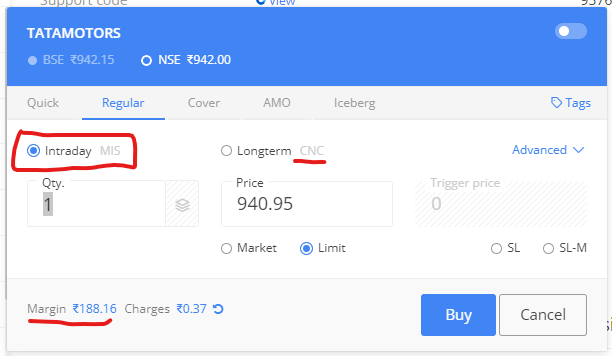
MIS – Management Information System (Intraday)
Management Information System (MIS) in the context of intraday trading refers to a specific type of trading account or order that allows traders to leverage their positions for trades that are opened and closed within the same trading day. MIS is a term more commonly used in Indian stock markets by trading platforms and brokers. It’s designed to cater to the needs of day traders who seek to capitalize on the daily movements of the stock market without carrying their positions overnight.
Key features and aspects of MIS (Management Information System) for intraday trading include:
- Leverage: MIS orders provide higher leverage compared to normal orders, meaning traders can trade larger amounts with a relatively smaller capital. This leverage varies across different brokers and securities.
- Auto Square-off: Positions under MIS are automatically squared off by the broker if they are not closed by the trader before the specified cut-off time, which is usually near the market closing time. This policy is to ensure that no MIS position is carried over to the next trading day.
- Lower Margins: Since these are intraday trades, the margin requirements are usually lower compared to delivery trades where the stock is held overnight. The lower margin requirement is due to the reduced risk of holding positions for a short duration.
- Marked for Intraday: Trades executed under MIS are specifically marked for intraday trading. This designation is crucial for the broker’s system to recognize these trades for auto square-off and for applying the relevant leverage and margin rules.
- Risk Management: While MIS provides an opportunity for higher profits due to leverage, it also comes with increased risk. Traders need to be vigilant and have effective risk management strategies in place, such as stop-loss orders, to minimize potential losses.
- Brokerage and Charges: Brokers might offer different brokerage rates and charges for MIS trades compared to normal trades. It’s important for traders to be aware of these charges as they can affect the overall profitability of intraday trading activities.
MIS for intraday trading is a tool that can be powerful in the hands of experienced traders who understand the market dynamics and have a good grasp on technical analysis and risk management. However, due to the inherent risks of leveraging and the fast-paced nature of intraday trading, it’s advisable for novice traders to approach MIS with caution and ideally, gain experience with less risky trades before venturing into leveraged intraday trading.
NRML – Normal Margin Order ( Overnight Position)
“NRML” stands for Normal Margin Order, which is a term commonly used in the context of trading on various stock and commodities exchanges in India. An NRML order is essentially a type of order that allows traders to hold positions overnight or for a longer duration without any need to square off the position the same day.
Key Features of NRML – Normal Margin Order:
- Overnight Positions: NRML orders enable traders to hold positions for more than one day. This is particularly useful for traders who wish to adopt medium to long-term strategies, waiting for significant market movements to realize their investment’s potential.
- Margin Requirements: To place an NRML order, traders are required to have the full margin amount in their trading account. The margin is usually a percentage of the total value of the trade, set by the exchange or the brokerage firm. This margin acts as collateral to hold positions overnight.
- No Intraday Leverage: Unlike intraday orders, which may offer higher leverage (allowing traders to trade larger amounts with less capital), NRML orders require traders to commit the full margin upfront, as they entail holding positions beyond the day’s close.
- Applicability: NRML orders can be used for trading in derivatives such as futures and options, as well as in the equity segment for stocks that allow delivery-based trading.
- Flexibility in Holding Period: There is no predetermined holding period for positions taken using NRML orders. Traders can hold their positions for as long as they want, subject to the contract’s expiry in the case of derivative instruments and as long as they maintain the necessary margins.
- Rollover Possibility: In the context of futures and options, NRML positions can be rolled over to the next expiry cycle, allowing traders to extend their positions beyond the current contract expiry by entering into a new contract.
- Risk Management: Using NRML orders requires careful risk management, as holding positions overnight exposes the trader to potential market gaps and volatility that can occur outside of trading hours.
- Settlement and Delivery: For equity trades placed using NRML, if the intention is to take delivery (in case of a buy order) or provide delivery (in case of a sell order) of the shares, the necessary securities or funds need to be available in the account at the time of settlement.
NRML orders are a fundamental tool for traders looking to engage in strategies that span across multiple days, weeks, or even months, offering the potential for significant returns while also necessitating a cautious approach to risk and capital management.
Intraday – Trading in one day from 9:15 am to 3:30Pm
Intraday trading, also known as day trading, refers to the practice of buying and selling financial instruments within the same trading day. This means all positions are closed before the market closes for the trading day. Intraday trading is popular in stock markets and forex markets, among others. The timing mentioned, 9:15 AM to 3:30 PM, specifically aligns with the standard trading hours for the Indian stock market, including the National Stock Exchange (NSE) and Bombay Stock Exchange (BSE).
Here are some key aspects of intraday trading:
- Objective: The primary goal of intraday trading is to capitalize on small price movements in highly liquid stocks or currencies. Traders aim to earn profits from these short-term price fluctuations.
- Leverage: Intraday traders often use leverage to amplify their trading capital. This means they can trade with more money than they actually have in their trading account, which can increase both potential profits and potential losses.
- Market Analysis: Successful intraday traders typically rely on technical analysis and chart patterns to make trading decisions. This involves analyzing price movements and trading volumes to predict future price behavior.
- Risk Management: Given the high risk and volatility in intraday trading, effective risk management strategies are crucial. This includes setting stop-loss orders to limit potential losses and only risking a small percentage of the trading capital on a single trade.
- Speed and Efficiency: Intraday trading requires the ability to make quick decisions and execute trades efficiently. Many traders use trading platforms that offer real-time market data and advanced trading tools to help them react swiftly to market movements.
- Costs and Fees: Traders should be aware of the costs involved, including brokerage fees, transaction fees, and taxes. These costs can eat into profits, especially if a large number of trades are made in a day.
- Psychological Aspects: Intraday trading can be stressful and requires discipline, patience, and emotional control. Traders must be able to cope with the pressures of rapid decision-making and the potential for financial loss.
- Regulatory Aspects: Different countries have specific regulations governing intraday trading. Traders need to be aware of these rules, including any restrictions on leverage, margin requirements, and pattern day trader rules.
Intraday trading is not suitable for everyone due to its high-risk nature. It requires a good understanding of the markets, a well-thought-out strategy, and the ability to manage risks effectively. Beginners are advised to start with a demo account or with small amounts to understand the nuances of day trading before committing significant capital.
PCR – Put Call Ratio
The Put-Call Ratio (PCR) is a popular indicator used by investors and traders to gauge the overall mood of the market. It’s calculated by dividing the number of traded put options by the number of traded call options. The resulting ratio can help investors understand whether the market is bullish or bearish, based on the prevailing trading volumes of puts and calls.
Understanding Put and Call Options:
- Call Options: These are financial contracts that give the buyer the right, but not the obligation, to buy a stock or another financial instrument at a specified price within a specific time period. Buying call options is typically seen as a bullish move, as the investor is betting that the stock’s price will increase.
- Put Options: Conversely, put options give the buyer the right, but not the obligation, to sell a stock at a specified price within a specific time period. Buying put options is generally viewed as a bearish action, as the investor is speculating that the stock’s price will decline.
Interpreting the Put-Call Ratio (PCR):
- High PCR (>1): A PCR above 1 indicates that there are more puts being bought than calls. This is typically interpreted as a bearish sentiment, suggesting that investors are expecting the market to decline.
- Low PCR (<1): A PCR below 1 suggests that there are more calls being bought than puts, indicating a bullish market sentiment with expectations of rising prices.
- PCR = 1: When the ratio is equal to 1, it indicates a balanced market with equal numbers of puts and calls being traded. This scenario is less common and doesn’t strongly indicate either a bullish or bearish sentiment.
Usage and Limitations:
The Put-Call Ratio is used as a contrarian indicator. Some traders believe that extreme levels of the PCR (either very high or very low) indicate that the market is at a turning point. For instance, an extremely high PCR might suggest that the market is overly pessimistic and could be due for a reversal (upward), whereas an extremely low PCR might suggest excessive optimism and a potential downward correction.
However, like all market indicators, the PCR has its limitations and should not be used in isolation. Market conditions, news, and other economic indicators should also be considered when making investment decisions. Additionally, the PCR can vary significantly across different stocks, sectors, and indices, so it’s important to consider the context when interpreting the ratio.
In summary, the Put-Call Ratio is a useful tool for gauging market sentiment, but it should be part of a broader analysis strategy that takes into account various market factors and individual investment goals.
RSI – Relative Strength Index
The Relative Strength Index (RSI) is a momentum oscillator that measures the speed and change of price movements. Developed by J. Welles Wilder Jr. and introduced in his 1978 book “New Concepts in Technical Trading Systems,” the RSI is one of the most widely used technical indicators in trading. It operates on a scale from 0 to 100 and is typically used to identify overbought or oversold conditions in a market, aiming to predict potential reversals in price.
Key Features of RSI
- Calculation: The RSI is calculated based on the average gains and losses over a specified period, typically 14 days. The formula is: RSI = 100 – (100 / (1 + RS)), where RS is the average of x days’ up closes divided by the average of x days’ down closes.
- Overbought and Oversold Levels: Traditionally, the RSI value above 70 indicates that a security may be overbought or overvalued and may be primed for a trend reversal or corrective pullback in price. Conversely, an RSI value below 30 suggests an oversold or undervalued condition.
- Divergence: Divergence occurs when the RSI direction diverges from the price direction. An upward movement in price with a downward trend in RSI can signal a price reversal to the downside. Similarly, a downward movement in price with an upward trend in RSI can indicate a potential reversal to the upside.
- Centerline Crossover: The RSI value of 50 acts as a centerline between bullish and bearish territories. A move above 50 can signal an emerging bullish trend, while a drop below 50 suggests a developing bearish trend.
Applications and Limitations
- Trend Confirmation: Traders often use RSI in conjunction with other indicators and analysis techniques to confirm trend direction and strength.
- Entry and Exit Points: RSI can help identify potential entry and exit points based on overbought and oversold signals and divergence patterns.
- Limitations: Like all indicators, RSI should not be used in isolation. False signals can occur, and overbought or oversold conditions may persist in strong trending markets. Combining RSI with other analysis tools can improve decision-making.
The RSI is a versatile tool that, when used correctly, can help traders and investors identify potential price reversal points, confirm trend strength, and make informed trading decisions. However, it’s crucial to incorporate other forms of analysis to mitigate risks associated with relying solely on one indicator.
EMA – Exponential Moving Average
The Exponential Moving Average (EMA) is a type of moving average that places a greater weight and significance on the most recent data points. Unlike the Simple Moving Average (SMA) that calculates the average of prices over a specified period equally, the EMA gives more importance to recent prices, making it more responsive to new information and price changes. This characteristic makes the EMA a preferred choice for many traders and analysts, especially those looking to identify trends in a more timely manner.
Key Features of EMA:
- Weighted Averages: EMA uses a weighting multiplier to give more importance to recent data points. The weighting applied to the most recent price depends on the selected time period of the EMA. The shorter the EMA period, the more weight that will be applied to the most recent price.
- Sensitivity: Due to its focus on recent prices, the EMA is more sensitive to price movements compared to the SMA. This sensitivity makes it a useful tool for identifying trends earlier, potentially providing traders with opportunities to enter or exit trades more effectively.
- Calculation Complexity: Calculating the EMA is a bit more complex than calculating the SMA. It involves using a smoothing factor derived from the EMA’s period, which is then applied to the difference between the current period’s price and the previous period’s EMA. This process continues for each period in the data set.
- Trading Applications: Traders use EMA to identify the direction of the trend, support and resistance levels, and potential reversal points in the market. It’s commonly used in conjunction with other indicators and analysis techniques to confirm trends and signals.
- Multiple Time Frames: Traders often use multiple EMAs with different time frames on the same chart to get a more comprehensive view of the market. For example, a short-term EMA (like a 10-day) alongside a long-term EMA (like a 50-day) can provide insights into the immediate direction of the market relative to its longer-term trend.
How to Interpret EMA:
- Trend Identification: A rising EMA indicates an uptrend, while a falling EMA suggests a downtrend.
- Price Crossovers: When the price crosses above the EMA, it could signal a potential upward move, and vice versa for a downward move.
- EMA Crossovers: The crossover of a short-term EMA above a long-term EMA may indicate a bullish signal, while the opposite crossover could suggest a bearish signal.
In summary, the EMA is a dynamic tool that can help traders and investors quickly adapt to changing market conditions by highlighting recent trends and potential reversal points. Its emphasis on recent data makes it a valuable component of a technical analyst’s toolkit.
Advance/Decline Ratio – Companies in Green or Red
The Advance/Decline Ratio (A/D Ratio) is a market breadth indicator used by investors and analysts to gauge the overall health of the stock market. It does this by comparing the number of stocks that have advanced (closed higher than they opened) to the number of stocks that have declined (closed lower than they opened) over a particular period. The A/D Ratio can help identify the overall direction of the market and signal the strength of a market movement, whether bullish or bearish.
How It Works
The formula for the Advance/Decline Ratio is:
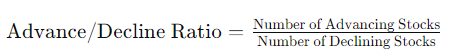
- Advancing Stocks: These are the stocks that closed at a higher price than their opening price for the day.
- Declining Stocks: These are the stocks that closed at a lower price than their opening price for the day.
Interpretation
- A/D Ratio > 1: Indicates more companies are closing in green (price went up) than in red (price went down), suggesting a bullish market sentiment.
- A/D Ratio < 1: Indicates more companies are closing in red than in green, suggesting bearish market sentiment.
- A/D Ratio = 1: Indicates an equal number of companies closed in green and red, suggesting a balanced or undecided market sentiment.
Companies in Green or Red
- Companies in Green: This refers to stocks that have advanced during the trading session, closing at a higher price than they opened. It’s a positive indicator for those specific stocks and can contribute to a higher A/D Ratio.
- Companies in Red: This refers to stocks that have declined during the trading session, closing at a lower price than they opened. It’s a negative indicator for those specific stocks and can contribute to a lower A/D Ratio.
Usage
The A/D Ratio is often used in conjunction with other market indicators to confirm trends or signal potential reversals. For example, if the market is reaching new highs but the A/D Ratio is declining, it could indicate that fewer stocks are participating in the rally, suggesting that the market might be weakening.
Investors and traders use the A/D Ratio to help make informed decisions about market entry and exit points, portfolio diversification, and risk management. However, like all market indicators, it should not be used in isolation but rather as part of a comprehensive analysis strategy.
Strike Price – ITM/OTM/ATM
Strike Price is a fundamental concept in options trading, relating to the predetermined price at which the holder of an option can buy (in the case of a call option) or sell (in the case of a put option) the underlying asset. The relationship between the strike price of an option and the current market price of the underlying asset determines whether an option is in-the-money (ITM), out-of-the-money (OTM), or at-the-money (ATM). Here’s a breakdown of these terms:
In-the-Money (ITM)
- Call Option: A call option is ITM when the strike price is below the current market price of the underlying asset. This means the option holder can buy the asset at a price lower than the market price.
- Put Option: A put option is ITM when the strike price is above the current market price of the underlying asset. This allows the option holder to sell the asset at a price higher than the market price.
ITM options have intrinsic value and are generally considered more valuable.
Out-of-the-Money (OTM)
- Call Option: A call option is OTM when the strike price is above the current market price of the underlying asset. Buying the asset at the strike price would be more expensive than buying it at the market price.
- Put Option: A put option is OTM when the strike price is below the current market price of the underlying asset. Selling the asset at the strike price would fetch a lower price than selling it at the market price.
OTM options do not have intrinsic value and are considered less valuable, though they may still hold potential for profitability if the market moves favorably.
At-the-Money (ATM)
- Both call and put options are considered ATM when the strike price is equal to (or very close to) the current market price of the underlying asset.
ATM options are on the threshold between having intrinsic value and not, depending on how the market price of the underlying asset moves.
Understanding the relationship between the strike price and the market price is crucial for options traders, as it helps them assess the potential profitability of different options strategies and manage risk. ITM options are generally more expensive to purchase due to their intrinsic value, while OTM options are cheaper but riskier, as they require the market to move favorably to become profitable.
Gift Nifty – Nifty traded on Singapore stock exchange
The term “Gift Nifty” refers to Nifty futures contracts that are traded on the Singapore Stock Exchange (SGX). It’s important to clarify that the terminology might be colloquially used and not officially recognized in professional financial literature. However, the concept it refers to is well-understood and significant in the context of international trading and investment.
Nifty refers to the Nifty 50 index, which is a stock market index representing a weighted average of 50 of the largest and most liquid Indian stocks listed on the National Stock Exchange (NSE). It’s a benchmark index for the Indian equity market, similar to how the S&P 500 serves as a benchmark for the American equity market.
The Nifty futures contracts traded on the Singapore Stock Exchange are essentially derivatives that allow investors to bet on the future value of the Nifty 50 index. These futures contracts are popular among international investors who wish to gain exposure to the Indian stock market without having to directly trade in the Indian stock exchanges. Trading Nifty futures on the SGX provides several advantages, such as longer trading hours that overlap with both Asian and European market hours, and the convenience for investors based outside India.
Trading Nifty futures on the SGX (referred to here as “Gift Nifty”) offers an important avenue for global investors to participate in the Indian equity market, contributing to the global liquidity and visibility of Indian stocks. It’s worth noting that while this offers a valuable mechanism for international investment, investors also need to be aware of the risks associated with currency fluctuations and geopolitical factors that can affect the performance of such investments.
Premium
The term “premium” has multiple meanings across different contexts, particularly in finance, insurance, and commerce. Below is an overview of how “premium” is used in various sectors:
1. Insurance:
In insurance, a premium is the amount paid by the policyholder to the insurance company to keep an insurance policy active. This payment can be made on different schedules, such as monthly, quarterly, semi-annually, or annually. The premium amount is determined based on various factors, including the type of coverage, risk assessment, policy term, and the policyholder’s personal details (e.g., age, health status for life insurance).
2. Finance and Investments:
- Bond Markets: For bonds, a premium refers to the amount by which a bond’s selling price exceeds its face value. Bonds sell at a premium when the interest rate they pay is higher than the current market rate.
- Options Trading: In options trading, the premium is the price paid by the buyer to the seller to acquire the option. It represents the income received by the seller, and the cost to the buyer, for the rights granted by the option.
- Stock Markets: A stock may trade at a premium in the market if it is valued higher due to its perceived quality, potential for growth, or other favorable factors compared to its peers.
3. Commerce:
- Goods and Services: The term premium can also refer to high-quality or superior products or services that are sold at a higher price. Premium brands or products are often associated with luxury, higher specifications, or better performance.
4. Banking:
- Premium Accounts: In banking, premium accounts are those that offer additional benefits and services to account holders, often in exchange for maintaining a higher minimum balance or paying a fee. These benefits can include higher interest rates, waived fees, or access to exclusive services.
5. Marketing:
- Premium Pricing Strategy: This is a pricing strategy where goods or services are priced higher than the market average to emphasize their superior quality, exclusivity, or brand positioning. This strategy aims to attract consumers who are willing to pay more for perceived additional value.
Understanding the specific context in which “premium” is used is crucial, as its meaning can significantly vary across different industries and scenarios.
BTST – Buy Today sell Tomorrow
“BTST” stands for “Buy Today Sell Tomorrow.” It is a trading strategy used in the stock market, where a trader buys shares of a company on one day and sells them the next trading day. This strategy is utilized by traders to capitalize on the stock’s price movements within this short timeframe. Here are some key points regarding BTST:
- Objective: The main goal of BTST is to take advantage of the positive overnight price movement of a stock. Traders anticipate that the stock price will rise from the closing price of the day they bought it to the next day’s trading session.
- Market Settlement Cycle: BTST trading is possible due to the settlement cycle in the stock market. In many markets, there’s a T+2 settlement period, meaning transactions are settled two business days after the trade date. BTST exploits this window, allowing traders to sell the stock before having to actually settle the purchase.
- Risk and Rewards: BTST can be lucrative if the stock’s price moves favorably overnight, but it also carries significant risk. Stock prices can be affected by overnight news, global market trends, or other factors that might lead to unfavorable price movements.
- Not Allowed for All Stocks: Some markets or brokers might have restrictions on which stocks can be traded on a BTST basis, often due to liquidity or volatility concerns. It’s important for traders to check these details before executing BTST trades.
- Requires Market Knowledge: Successful BTST trading requires a good understanding of market trends, the ability to analyze news and its potential impact on stock prices, and a strong sense of timing. It’s more suited to experienced traders who can afford to take the associated risks.
- Tax and Brokerage Considerations: Profits from BTST trades are typically treated as short-term capital gains and taxed accordingly. Traders should also consider brokerage fees, which can eat into profits from short-term trades like BTST.
- Strategy Execution: To execute a BTST trade, a trader must have a brokerage account that allows for this type of trading. They must closely monitor the market and news to make informed buying and selling decisions.
BTST is a strategy that appeals to traders looking to make quick profits from short-term price movements in the stock market. However, due to its speculative nature, it’s important for those considering BTST trades to be aware of the risks and to conduct thorough market analysis before engaging in this type of trading.
STBT – Sell Today Buy Tomorrow
“STBT” stands for “Sell Today Buy Tomorrow,” a trading strategy used in the stock market. This term is specifically relevant in contexts where traders are looking to profit from short-term movements in stock prices. Here’s a breakdown of the key aspects of the STBT strategy:
- Short Selling: STBT involves short selling, which means selling securities that the trader does not currently own, with the expectation that the stock price will decline. The trader borrows the stock to sell it at the current market price and aims to buy it back later at a lower price.
- Market Expectation: The core idea behind STBT is the trader’s expectation that the stock price will fall in the very short term, i.e., from today (the selling day) to tomorrow (the buying day). This strategy is based on analysis or speculation regarding downward price movements.
- Profit Objective: The profit from an STBT trade is the difference between the price at which the stock was sold and the lower price at which it is bought back. After buying back the stock, it is returned to the lender, and the trader keeps the profit margin.
- Risks: STBT, like any form of short selling, carries significant risk. If the stock price increases instead of decreasing, the trader will have to buy back the stock at a higher price than it was sold for, resulting in a loss. The potential for loss is theoretically unlimited since there’s no cap on how high a stock price can rise.
- Regulatory and Market Constraints: Not all markets or regulatory environments allow for STBT due to the risks and potential for market manipulation associated with short selling. Traders need to be aware of the regulations and restrictions in their specific market.
- Requires Market Access: STBT requires the ability to engage in short selling, which typically means having access to a margin account that allows for the borrowing and selling of stocks not owned by the trader.
- Timing and Strategy: Successful STBT trading requires precise timing and a well-founded strategy, often based on technical analysis, market trends, or news that may affect stock prices. Traders also need to be vigilant about market changes that could impact their positions.
STBT is a sophisticated trading strategy that appeals to experienced traders who are comfortable with high-risk, high-reward scenarios. It requires a deep understanding of market mechanisms, access to real-time market data, and the ability to quickly respond to market movement.
Option Buyer – Contracts Buyers
The terminology “Option Buyer” or “Contracts Buyer” refers to participants in the financial markets, particularly in the context of options trading. Options are financial derivatives that give the buyer the right, but not the obligation, to buy (in the case of a call option) or sell (in the case of a put option) an underlying asset at a specified price (strike price) on or before a certain date (expiration date). Here are key points about option buyers:
- Right, Not Obligation: Option buyers acquire the right to execute the trade of an underlying asset but are not obligated to do so. This characteristic distinguishes options from futures contracts, where there is an obligation to execute the trade.
- Premium Payment: To acquire this right, the option buyer pays a premium to the seller (writer) of the option. This premium is the cost of the option and is determined by various factors including the underlying asset’s current price, strike price, time until expiration, volatility, and interest rates.
- Potential for Profit: Option buyers can profit if the market moves in a direction favorable to their position. For a call option buyer, profit potential arises if the underlying asset’s price exceeds the strike price by more than the premium paid. For a put option buyer, profit potential arises if the underlying asset’s price falls below the strike price by more than the premium paid.
- Limited Risk: The risk for option buyers is limited to the amount of the premium paid for the option. Unlike the sellers of options, who can face unlimited risk, buyers know their maximum potential loss at the time of purchase.
- Speculation and Hedging: Option buyers might be speculators looking to profit from price movements in the underlying asset or hedgers seeking to protect against adverse price movements in assets they own or plan to own.
- Expiration: If the option is not exercised before or at expiration, it expires worthless, and the buyer loses the premium paid. Option buyers must therefore carefully consider the timing of their investments relative to their expectations for the underlying asset.
- Leverage: Options provide leverage, meaning that with a relatively small amount of capital (the premium), an investor can control a larger position in the underlying asset. This leverage can amplify returns but also magnifies the potential for loss, relative to the premium paid.
In summary, option buyers are investors or traders who pay a premium for the right to buy or sell an underlying asset at a predetermined price, seeking to profit from expected price movements while limiting their risk to the premium paid.
Option Seller – Contract Seller
The terminology “Option Seller” or “Contract Seller” refers to participants in the options market who engage in the selling (or “writing”) of options contracts. Options are financial derivatives that give the buyer the right, but not the obligation, to buy (in the case of a call option) or sell (in the case of a put option) an underlying asset at a predetermined price (strike price) within a specific time period. Here’s a breakdown of key points regarding option sellers:
- Option Seller (Writer): An option seller, also known as an option writer, is the party that creates an options contract and sells it in the market. By selling the contract, the writer receives a premium from the option buyer. This premium is essentially the price the buyer pays to obtain the rights that the option contract grants.
- Obligations of the Option Seller: Unlike the buyer of an option, who has the right but not the obligation to exercise the option, the seller has a potential obligation. If the buyer decides to exercise the option, the seller must fulfill the contract’s terms. For a call option, this means selling the underlying asset at the strike price; for a put option, it means buying the underlying asset at the strike price.
- Risk for Option Sellers: Selling options involves significant risk, especially for uncovered (naked) positions. If the market moves against the position, the potential losses for the seller can be substantial. For example, in selling a call option without owning the underlying asset, the seller risks unlimited losses if the asset’s price rises sharply.
- Covered and Naked Option Selling:
- Covered Option Selling: This occurs when the seller owns the underlying asset (for a call option) or has the cash to buy the underlying asset (for a put option). It limits the risk since the seller is prepared to meet the obligations if the option is exercised.
- Naked Option Selling: In this riskier strategy, the seller does not own the underlying asset or have specific protections in place. The potential for loss is higher, especially with naked call selling.
- Motivation for Selling Options: Sellers typically enter these contracts to earn the premium as income, betting that the option will expire worthless and they won’t have to fulfill the contract. It’s a strategy often used by investors to generate returns on holdings or to speculate on market movements.
- Margin Requirements: Due to the risks involved, brokers require option sellers to maintain margin accounts to cover potential losses. These requirements can be substantial, especially for naked options.
Option selling is a complex strategy that requires a good understanding of the market and risk management. It can be profitable but involves significant risk, particularly for naked options. Investors should carefully consider their risk tolerance and investment objectives when engaging in options selling.
Hedging – Way of Risk Management
Hedging is a financial strategy used to minimize or manage the risk of price movements in assets, commodities, currencies, or securities. It involves taking an investment position intended to offset potential losses or gains that may be incurred by a companion investment. Here’s a brief overview of key aspects of hedging as a way of risk management:
- Purpose of Hedging: The primary goal of hedging is not necessarily to prevent losses but to limit the uncertainty and stabilize the financial performance of investments or business operations. It helps investors and companies protect against adverse price movements that could significantly impact their finances.
- How It Works: Hedging typically involves the use of financial instruments known as derivatives, which include options, futures, forwards, and swaps. For example, an investor holding a portfolio of stocks might purchase put options to protect against potential declines in the stock market. Similarly, a company that expects to receive payment in a foreign currency in the future might use currency futures to protect against exchange rate fluctuations.
- Types of Risks Hedged: Common risks that entities hedge against include commodity price risk, currency exchange rate risk, interest rate risk, and equity price risk. Businesses may also hedge against other operational risks, such as changes in weather or regulatory changes that could impact costs or revenues.
- Examples of Hedging:
- Commodity Hedging: An agricultural producer might use futures contracts to lock in prices for their crops ahead of the harvest, protecting against the risk of price declines.
- Currency Hedging: A company operating internationally might use currency forwards or options to protect against the risk of adverse currency movements affecting their foreign transactions.
- Interest Rate Hedging: Financial institutions and borrowers might use interest rate swaps to manage the risk of fluctuating interest rates affecting their loan costs.
- Costs and Considerations: While hedging can reduce risk, it also involves costs such as premiums for options contracts, transaction fees, and the potential opportunity cost of limiting gains if the hedged risk does not materialize as expected. Therefore, the decision to hedge should be based on a careful assessment of these costs against the potential benefits of risk reduction.
- Strategic Hedging: Effective hedging requires a strategic approach, including identifying exposure to risks, selecting the appropriate hedging instruments, and continuously monitoring and adjusting the hedge positions as market conditions change.
Hedging is a sophisticated risk management tool widely used across various industries and investment portfolios. It allows entities to focus on their core activities or investment strategies by mitigating the potential negative impacts of market volatility and other risk factors.
ROI – Return On Investment
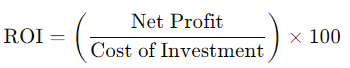
“ROI – Return on Investment” is a widely used financial metric that measures the efficiency or profitability of an investment. It calculates the return generated on an investment relative to its cost.
Calculation: The basic formula for calculating ROI is:
Here’s a concise overview:
- Definition: ROI is a ratio or percentage that compares the gain or loss from an investment relative to its cost. It is a straightforward measure used to evaluate the potential return from a stand-alone investment or to compare the efficiency of several investments.
- Interpretation: A higher ROI percentage indicates a more profitable investment. ROI helps investors decide where to allocate their funds by comparing the efficiency of different investments. It’s useful for assessing investments in stocks, real estate, businesses, and other financial vehicles.
- Versatility: ROI is a versatile metric that can be applied across a wide range of investment types. However, its simplicity means it does not always account for variables like investment duration, risk factors, or capital costs, which can be crucial in investment decisions.
- Limitations: While ROI is helpful for quick comparisons and initial assessments, it does not consider the time value of money, and it may not provide a comprehensive view of an investment’s performance over time. Investors often use ROI in conjunction with other metrics for a more detailed analysis.
- Applications: Beyond financial investments, ROI is also used in business and project management to evaluate the efficiency of spending and to justify or prioritize spending decisions.
Understanding ROI allows investors and businesses to make informed decisions by quantifying the financial return of their investments relative to their costs, thereby aiding in the optimization of resource allocation for maximum profitability.
SL – Stop loss
The term “Stop Loss” (SL) is widely used in finance, particularly in trading and investing. It refers to an order placed with a broker to buy or sell a security once it reaches a certain price. The primary purpose of a stop loss order is to limit an investor’s loss on a security’s position. Here’s a breakdown of key aspects regarding stop loss:
- Risk Management Tool: A stop loss is essentially a risk management tool that helps investors prevent significant losses in a volatile market. By setting a stop loss order, an investor can specify the maximum amount they are willing to lose on a particular investment.
- How It Works: If you own a stock, you can place a stop loss order at a price below the current market price. If the stock’s price falls to this level, the stop loss order becomes a market order, instructing your broker to sell the stock at the next available price to minimize your losses.
- Types of Stop Loss Orders:
- Standard Stop Loss: Triggers a sale once the stock hits the stop price.
- Trailing Stop Loss: Automatically adjusts the stop price as the stock price moves, maintaining a specified distance (either in percentage or dollar amount) from the current market price.
- Benefits:
- Automates the Sell Process: It removes the emotional aspect of selling, making the process automatic once the set conditions are met.
- Protects Capital: By limiting potential losses, it helps investors protect their capital from significant downturns.
- Considerations:
- Gap Risk: Stop loss orders may not be executed at the specified price if the stock price gaps down below the stop price. The order will be executed at the next available price, which could be significantly lower.
- Short-term Fluctuations: Setting the stop loss too close to the current price may result in the order being triggered by normal short-term market fluctuations, potentially selling an asset prematurely.
- Strategic Use: Investors and traders use stop loss orders strategically to manage their investments efficiently, deciding on stop loss levels based on their risk tolerance and the specific volatility of the securities they hold.
Overall, stop loss orders are a crucial part of trading and investing strategies for individuals looking to manage risks effectively in the financial markets.
Dividend – Shared by Companies after good profit
The term “dividend” refers to a portion of a company’s earnings that is distributed to its shareholders. Dividends are one of the ways in which companies share their profits with their investors, and they serve as a reward to shareholders for their investment and trust in the company. Here’s a brief overview of key aspects related to dividends:
- Payment Structure: Dividends are typically paid in cash, but they can also be distributed as additional shares of stock or other property. The most common form is cash dividends.
- Decision and Declaration: The decision to pay a dividend, along with its amount, is made by the company’s board of directors. Once declared, a dividend becomes a liability for the company and must be paid to shareholders on the declared payment date.
- Frequency: Dividend payouts can vary by company and by country, with common frequencies being quarterly, semi-annually, or annually. Some companies may also pay dividends irregularly.
- Dividend Yield: This is a financial ratio that shows how much a company pays out in dividends each year relative to its stock price. It is often used by investors to compare the attractiveness of different dividend-paying stocks.
- Significance: Dividends are seen as a sign of a company’s financial health and its commitment to returning value to shareholders. Companies that consistently pay dividends are often perceived as more stable and less risky than those that do not.
- Impact on Share Price: The announcement of a dividend typically has a positive impact on a company’s stock price, as it signals confidence in the company’s financial stability. Conversely, if a company reduces or eliminates its dividend, it can lead to a decrease in the stock price.
- Tax Implications: Dividend income is taxable for shareholders in many jurisdictions, though the tax treatment can vary. Some countries offer favorable tax treatment for dividends to encourage investment.
- Dividend Reinvestment Plans (DRIPs): Some companies offer DRIPs that allow shareholders to automatically reinvest their cash dividends into additional shares of the company’s stock, often without commission fees, facilitating the compounding of their investment.
Dividends are a key component of investment income, especially for income-focused investors. They represent a tangible return on investment, separate from any capital gains that may be realized through the appreciation of the stock’s price.
Contract Note – Buy / Sell time, Charge, tax, Brokerage
A “Contract Note” is a legal document used in the financial and trading sectors, especially within stock trading and investment. It is issued by a stockbroker to their client as a confirmation of the execution of a trade (buy or sell order) on a stock exchange. This document is crucial for both parties as it serves as proof of the transaction and details the terms and conditions under which the trade was executed. Here are the key components typically included in a contract note:
- Buy/Sell Time: This indicates the exact date and time when the buy or sell order was executed on the stock exchange. It’s crucial for record-keeping and helps in assessing the performance of the investment over time.
- Charge: This section outlines any additional charges incurred during the transaction. These could include various fees imposed by the exchange or regulatory bodies that are not directly related to the buying or selling price of the securities.
- Tax: This part details the applicable taxes on the transaction. In many jurisdictions, securities transactions are subject to specific taxes, such as Securities Transaction Tax (STT) in India or capital gains tax in other countries. The contract note will specify the amount of tax levied on the transaction.
- Brokerage: Brokerage is the fee charged by the broker for executing the trade on behalf of the client. It is usually a set percentage of the transaction value and is one of the primary costs associated with trading stocks. The contract note will detail the brokerage fee applied to the transaction.
- Details of the Transaction: Besides the above elements, the contract note also includes detailed information about the transaction, such as the type of security (stocks, bonds, etc.), the quantity traded, the price per unit at which the trade was executed, and the total value of the transaction.
- Client and Broker Details: It includes the name and contact information of the client and the broker, as well as any relevant client identification numbers or account numbers used in the transaction.
- Regulatory Information: The note may also contain information required by regulatory bodies, such as the name of the stock exchange where the transaction was executed and compliance statements.
A contract note is an essential document for investors as it serves as a record for monitoring investments, filing taxes, and resolving any disputes that may arise regarding the transaction. It ensures transparency between the broker and the client by clearly laying out all the costs and details of the trade.
Share Spits – Share Breakdown in Ratio
The terminology “Share Splits,” often referred to as “stock splits,” involves dividing the existing shares of a company into multiple new shares to boost the stock’s liquidity and make it more affordable to investors, without changing the company’s overall market capitalization. Here’s a concise explanation of key aspects:
- Definition: A share split is a corporate action decided by a company’s board of directors to increase the number of outstanding shares by issuing more shares to current shareholders. This is done by dividing each share into multiple ones, based on a predetermined ratio, such as 2-for-1, 3-for-1, etc.
- Ratios Explained: In a 2-for-1 split, for example, a shareholder would receive two shares for each share they own. If they owned 100 shares before the split, they would own 200 shares after the split, with the price of each share adjusted to half of its pre-split value to reflect the split.
- Market Capitalization Unchanged: While the number of shares outstanding increases and the share price adjusts accordingly, the total market value of the company (market capitalization) remains the same immediately after the split. Market capitalization is calculated as the share price times the number of outstanding shares.
- Purpose: Companies might opt for a share split to make shares more accessible to a wider range of investors by reducing the price per share. This can potentially increase liquidity and trading volume. It’s also often perceived as a positive signal by the market, indicating that the company’s management believes in the long-term growth of the company.
- No Value Change for Shareholders: Initially, the value of a shareholder’s investment does not change due to a share split. The increase in the number of shares is offset by the proportional decrease in the share price.
- Reverse Splits: Conversely, a company might undertake a reverse stock split, consolidating multiple shares into fewer, higher-priced shares (e.g., a 1-for-10 reverse split). This is often done to meet stock exchange listing requirements or to improve the stock’s perception in the market.
Share splits are administrative decisions that do not directly impact a company’s fundamentals but can influence investor sentiment and market dynamics related to the stock.
IPO – Initial Public Offering
An Initial Public Offering (IPO) is a critical financial term that refers to the process through which a private company becomes a publicly traded company by offering its shares to the public for the first time. This significant event allows a company to raise equity capital from public investors. Here are key points regarding IPOs:
- Capital Raising: The primary reason companies go public through an IPO is to raise capital. This infusion of funds can be used for various purposes, such as expansion, debt repayment, or improving the company’s balance sheet.
- Public Market Listing: An IPO involves listing the company’s shares on a public stock exchange, such as the New York Stock Exchange (NYSE) or NASDAQ in USA and National Stock Exchange (NSE) & National Bombay Exchange (BSE) In India, making it possible for individual and institutional investors to buy and sell the company’s stock.
- Pricing: The IPO process involves determining the initial share price through underwriting. Investment banks, acting as underwriters, help in setting the IPO price by assessing the company’s value, market conditions, and investor interest.
- Regulatory Requirements: Companies undergoing an IPO must meet specific regulatory requirements, including filing a registration statement with the relevant securities regulatory body, such as the U.S. Securities and Exchange Commission (SEC) in USA and Securities and Exchange Board of India (SEBI) in India. This document provides detailed information about the company’s financials, business model, and risk factors.
- Increased Scrutiny and Transparency: Once a company goes public, it is subject to increased scrutiny from regulators, investors, and the public. It must adhere to stricter reporting and disclosure requirements, including quarterly and annual financial reports.
- Market Perception and Brand Recognition: An IPO can enhance a company’s public profile, improving brand recognition and credibility. This can be beneficial in attracting new customers, partnerships, and employees.
- Liquidity and Exit Strategy: For early investors and company founders, an IPO provides an opportunity to sell shares and potentially realize significant gains. It also offers liquidity, making it easier to buy and sell shares compared to private shares.
- Potential for Significant Rewards and Risks: While an IPO can offer substantial rewards to early investors and the company, it also carries risks. Market volatility, fluctuating share prices, and the pressure to meet investor expectations can pose challenges.
An IPO is a landmark event in a company’s lifecycle, marking its transition from a private entity to a public one. It opens up new opportunities for growth and capital but also introduces new responsibilities and challenges.
Understanding these terms is not just about gaining knowledge; it’s about empowering oneself to navigate the financial markets confidently. Whether it’s differentiating between stocks and shares, interpreting market indices, or devising investment strategies, each piece of knowledge contributes to a more comprehensive understanding of how the stock market operates. This, in turn, enables investors to make more informed decisions, manage risks effectively, and potentially enhance the returns on their investments.
The journey into investing can be both exciting and challenging, but armed with the right knowledge, beginners can set themselves on a path to financial empowerment and success. Remember, every expert was once a beginner, and the first step to mastering the stock market is understanding its language.
Thank you for sharing your knowledge of email marketing product launches.